
Stoyan (@stoyanstefanov) is a frontend engineer, writer ("JavaScript Patterns", "Object-Oriented JavaScript"), speaker (JSConf, Velocity, Fronteers), toolmaker (Smush.it, YSlow 2.0) and a guitar hero wannabe.
The idea for this post actually came from the awesome Jeremy Hubert. I met him after a tech talk at Yahoo! I co-delivered and we talked about the presentation. The talk contained an opening part with the various business stats that were presented at Velocity this year (The Year of the Business Metrics) – not that I thought anyone at the tech talk needed to hear about business metrics. I believe developers are naturally attracted to performance, the same way as we are attracted to writing good quality maintainable code. We just like what we do and want to be good at it. The reason I added the business part is because I wanted to give the attendees something to “take home” and present to their bosses should their bosses need convincing. Jeremy suggested I should’ve instead created a downloadable presentation for people who are interested. So here is the said “business pitch” presentation plus added front-end pitch.
I intentionally kept the slides clean without much formatting. My hope is that you’ll find these slides useful to skin, update, mashup and build upon and deliver to your bosses and clients that need to be convinced to invest in performance and give you the time you need to work on performance improvements.
The slides are also on slideshare. In case you happen to have your client attentive and you don’t have the pitch handy, you can always deliver it from slideshare’s full screen view.
The rest of the post is the same as the contents of the powerpoint slides. The text under each slide is also added as a comment in the downloadable pitch.
It goes like this:
The Business of Performance

Does anybody like to wait in line at the cache register? Probably not. The same way probably no one likes one to sit and wait for slow web pages to finish loading.
The question is how does page loading time relate to the site’s business metrics – metrics such as revenue, user satisfaction and repeat visits? And why should we invest in making pages load faster?

The way to test the impact of slow pages on business metrics is traditionally done with split testing. You randomly separate the users into two buckets. Half get normal page, half get the same page but artificially slowed down at the server side. Then you slow down a little more and see how the business metrics change.
Conducting such experiments people quickly realize that slow is bad and stop the experiment in order not to lose users. So experiments usually end at half a second delay.
Bing.com (while formerly live.com) was brave enough to introduce artificial slow downs as long as 2 seconds. The results were that every one of the monitored business metric changed exponentially for the worse.
Just focusing on the revenue metric, you can see that making the page 1 second slower causes 2.8% drop in revenue. With 2 seconds delay the revenue drops 4.3%.

Similar experiment was done at Google where the search results page was artificially delayed with 0.4 seconds. This experiment shows two additional points:
- The negative effect on business metrics gets worse with time. The users may tolerate the slower page during first few visits but will then search increasingly less and even abandon the site
- The second point is that even after removing the delay, things didn’t get back to normal. There was an after-effect. Some people left the site for good, moved to the competition and didn’t return.
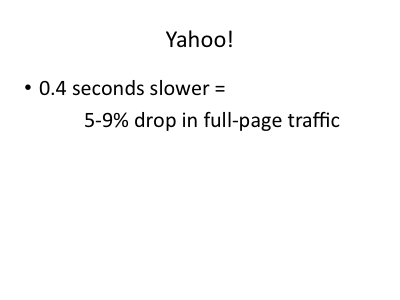
Similar experiment was done at Yahoo – as soon as the page gets 0.4 seconds slower, there is a drop in the fill page traffic. This means users leave the page before it’s loaded completely (before the onload event fires) – either hit Back button or click away from the page.
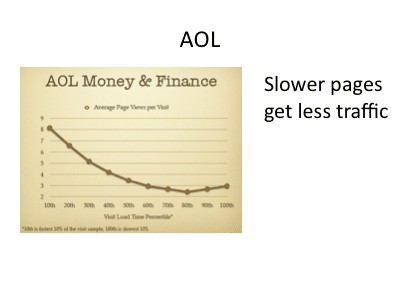
At AOL there was a measurement which tied the performance of individual pages with the number of visits those pages get.
The results were pretty clear – slow pages get fewer visits. Users learn to avoid them.
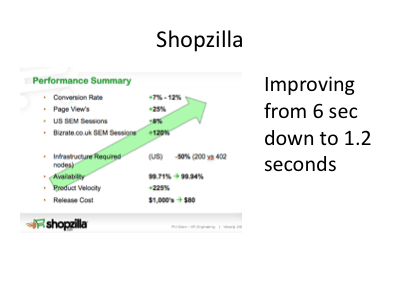
While the previous results showed how business metrics go down as the site gets slower, there is one study from Shopzilla that shows a more positive perspective – how business metrics improve as the site gets faster.
Shopzilla redesigned their site and went from page loading times around 6 seconds down to 1.2 seconds. As a result all metrics improved. The revenue increased with 7 to 12%, they got 25% more page views, the paid search traffic (from Search Engine Marketing) increased. And the required infrastructure to support the site was cut in half, which means they saved money while making more money.
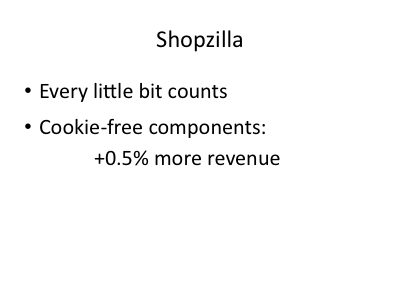
Another piece of stats from Shopzilla illustrates how even the smallest change can have a positive impact. They moved static components to be served from a domain without cookies and this one small change resulted in 0.5% more revenue.
In Yahoo’s list of performance best practices, this improvement is listed under number 24 (of 34) meaning that there’s much more important and beneficial improvements to be made, but still – every little bit counts.

With regards to cutting down expenses and saving money, here’s an example of what happened when Netflix enabled gzip compression for plain text components (gzipping is Yahoo’s performance recommendation #4, meaning it’s pretty important). Netflix noticed a sudden drop in outbound network traffic – they lowered their bandwidth bill by 43%.
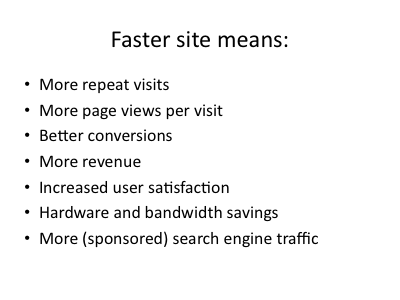
When it comes to business metrics, different sites measure success differently. For some it’s the number of new user signups, for some it’s time spent on the site, for others – the amount of sales. But in general, what can we expect when improving performance and page loading times? More repeating visits, more time spend on the site viewing more pages, better conversions and revenue, happier users. All that while paying less for hardware and bandwidth.
Also more search engine traffic. Since April 2008 Google takes into account your page loading time when ranking the sponsored search links (AdWords). Shopzilla’s stats are a testament to that. And Matt Cutts from Google has mentioned at a conference that there’s lobbying inside Google to extend the load time as factor for organic search results too. So far this hasn’t happened, but we can speculate that in the future a faster site may rank higher in Google’s search results bringing more new visitors to the site.

So a faster site means more business. And where do we start?
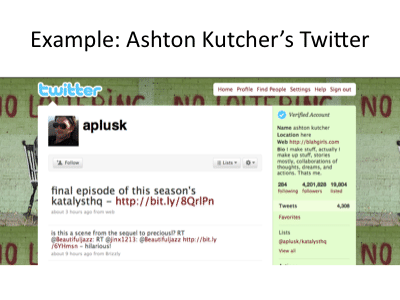
To answer that let’s look at one page and see where the time is spent for loading this page.
(This is where you can substitute this example with your page, or your client’s page. Then run the page through WebPageTest.org and copy the waterfalls to replace in the next two slides)

Here is the so called “waterfall view” showing how does the page load. The first bar is the page itself. All the others are different page components required by the page such as images, scripts and stylesheets.
As you can see only 10% of the time is spent on assembling the page from different sources such as data from the database. We can call this portion server-side time.
Once the server has done constructing the page and has sent it to the browser, the rest is browser time. And that’s where 90% of the time is spent – downloading all the page components. We can call this the front-end time.
Many people believe that the front-end time is not so important because all these images and other page components get downloaded once and then cached.
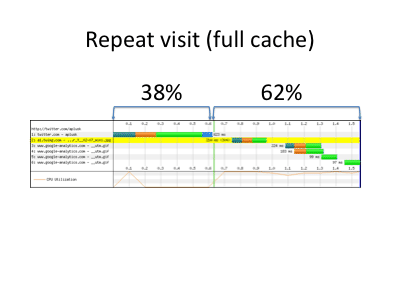
But even for repeat visits with full cache there’s still a few components to be loaded, and the scripts and styles to be executed from the cache. In this page example, still only 38% of the total time is server time.
And Yahoo’s research shows that 50-60% of all page visits (and 20% of all page views) will always be empty cache experience.
So the front-end matters and this is where the time is spent. For best ROI this is where you should be focusing – improving the front-end performance.
This is actually good news, because improving front-end performance is much easier than changing back-end systems, databases, infrastructure or reengineering server-side applications.
It’s easier to improve the front-end and it results in greater overall benefits. Gutting 10% in half won’t make a big difference, while cutting the 90% part in half will have a significant effect on the page loading time and therefore on the business metrics.

Credits/URLs
- Google, Bing: http://en.oreilly.com/velocity2009/…/8523
- Shopzilla: http://en.oreilly.com/velocity2009/…/7709
- Netflix: http://en.oreilly.com/velocity2008/…/3632
- AOL: http://en.oreilly.com/velocity2009/…/7579
- Yahoo!: http://www.slideshare.net/stoyan/yslow-20-presentation
- Bing graphic: http://www.watchingwebsites.com/archives/…-online-business
- Steve Souders: http://stevesouders.com
- Stoyan Stefanov: http://phpied.com
- Sponsored search and speed: http://adwords.google.com/…&answer=87144
Thanks!
I hope you enjoyed the the calendar and this last article. It was quite the experience for me, writing a post a night, sometimes way too late into the night. Many thanks to the guest bloggers – Christian, Eric and Ara (2 posts!) – thanks to you guys I was able to catch some sleep. Hopefully next year we can make it a bigger community effort with more contributors and a whole separate web site.
