

Alois Reitbauer (@aloisreitbauer) works as Technology Strategist for dynaTrace software and heads the dynaTrace Center of Excellence. As a major contributor to dynaTrace Labs technology he influences the companies future technological direction. Besides his engineering work he supports Fortune 500 companies in implementing successful performance management.
Web Performance Analysis can become quite challenging. Some tasks simply seem too complex to be achieved with any reasonable effort. For some there seems to be no solution at all. This makes performance analysis look like rocket science. I’ve collected a set a tasks which may at first sight seem to be difficult to achieve, but at the end turn to be much simpler than initially expected and not rocket science at all.
I will use dynaTrace Ajax Edition for my samples, as it is the tool we are building and I therefore know best. For many of the proposed approaches other tools such as YSlow, PageSpeed or SpeedTracer can be used as well. Enough introduction, now let’s look at the challenges.
Challenge: I need detailed and realistic diagnostics data for my web application. My local internet connection however does not allow me to collect reliable measurements. What can I do?
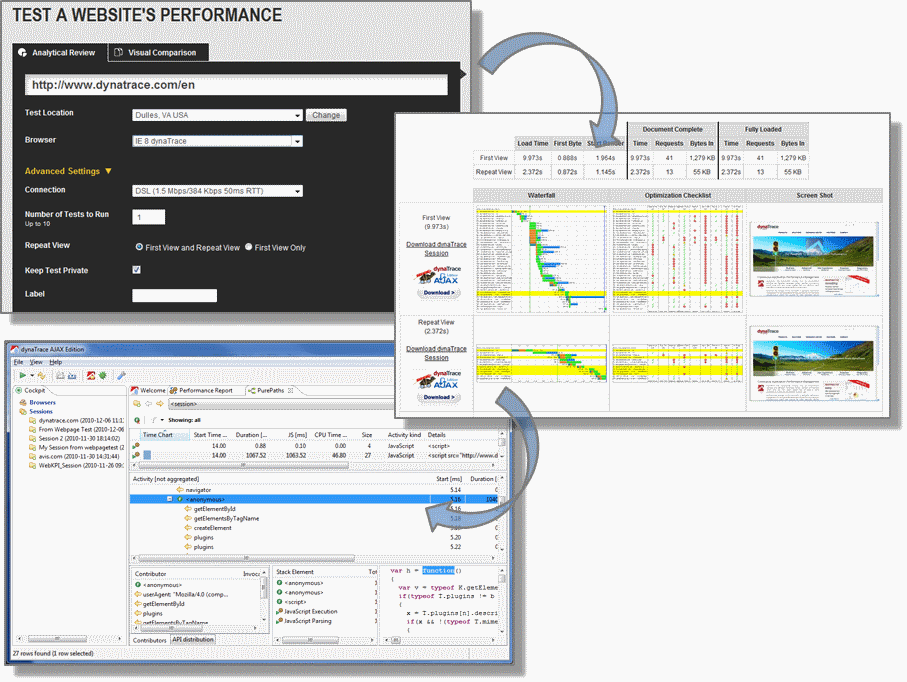
Testing from your local machine works fine if you want to check for typical problems like incorrect cache settings, non-minified files or page structure problems impacting download behavior. When you need detailed timing metrics using your local machine might turn out to un-representative from a speed perspective.
My preferred approach is to use webpagetest.org. Besides providing test locations from around the world it also provides detailed testing metrics. I usually use the Dulles location. Why? This location allows me to record a dynaTrace Session with all details I need which I can then later use to analyze performance in detail.
Once the test execution is finished I can download the session file and simply import it into dynaTrace Ajax Edition.
Challenge: I want to figure out how my site performance is compared to my competition. Do I have to measure the whole internet first? P.S. I am not Google
Comparing your site against others is essential for ensuring that end-users get the same or better performance and are not moving away to the competition. The tricky part here is how to get that data. While there are numerous posts with best practices regarding various timings, this does not mean that this is representative of your competition.
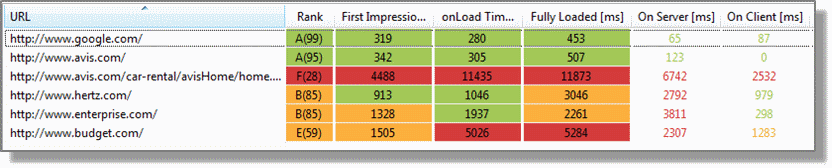
The main goal of benchmarking web performance is to track end-user-relevant metrics. So we are interested in First Impression Time, OnLoad Time and Total Load Time. We can get these metrics for our competition in two different ways.
First we navigate to each site we are interested in – including our own site – and then look at the page overview of the performance report. We get a comparison of all important metrics of the sites we visited and see where we are compared to the competition
While this is helpful for a fast comparison against a small amount of specific sites it gets quite tough if you want to compare yourself against a large number of sites – like the Alexa 1000. We also still have the problem that the test was performed locally. Fortunately there is an easier and more convenient way to do make this comparison.dynaTrace Ajax Edition provides the ability to compare important performance metrics against benchmarks calculated on a daily basis. These metrics are based on daily running automated tests from a server in a data center with a high speed internet connection.
We only have to download the latest benchmarks and select the category we want to compare against. The performance report will then show how your page relates to other pages in the selected category.

For all major end-user performance metrics the 50th and 95th percentile of the measured web pages are shown. For best-practice-based grades the distribution amongst the tested sites is shown. This provides a very clear picture of where your site stands.
Currently there are three categories available – Alexa 100, Alexa 500 and Alexa 1000. We are currently working on providing additional industry-specific categories.
Challenge: I want to detect performance regressions easily but all these manual comparisons drive me crazy. Do I have to give up my private life?
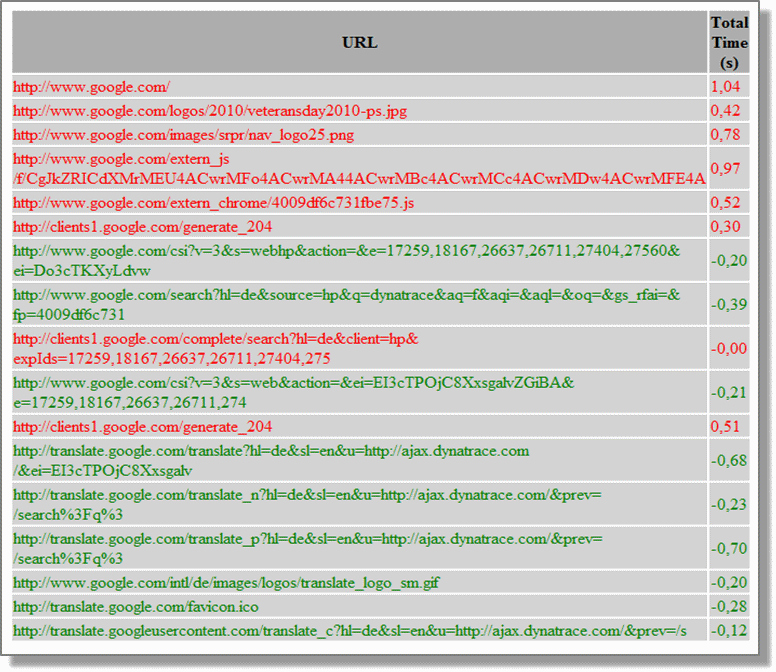
The good news is that you can keep your private life. Comparing performance data can become quite some work if you have to manually dig through a lot data and compare a lot of numbers.Using dynaTrace Ajax Edition you simply copy and paste the contents of any view and use the exported XML as input for your comparison. If you are specifically interested in the network part you can also use the HAR file export and also compare the results against results from other browsers.
<activitypath time_chart="" start_time_s="19.39" duration_ms="91.03" js_ms="91.03" cpu_time_ms="93.60" size="1018" activity_kind="JavaScript" details="load event on <window>"apis="" stats="-"/> <activitypath time_chart="" start_time_s="19.48" duration_ms="7.18" js_ms="7.18" cpu_time_ms="0.00" size="277" activity_kind="JavaScript" details="load event on <window>" apis="" stats="-"/> ...
If you write a few lines of code you can easily create a comparison report, which shows the parts of your application which degraded. Once you’ve invested a bit of time you get comparison reports for network activity, JavaScript execution and even the whole page download and execution order
Challenge: My pages execute gazillions of JavaScript code. Where is the magnet to find the needle in the haystack?
You are lucky, there is a proper magnet to find slow JavaScript code. The most straightforward way is to use the JavaScript view of the Performance Report.
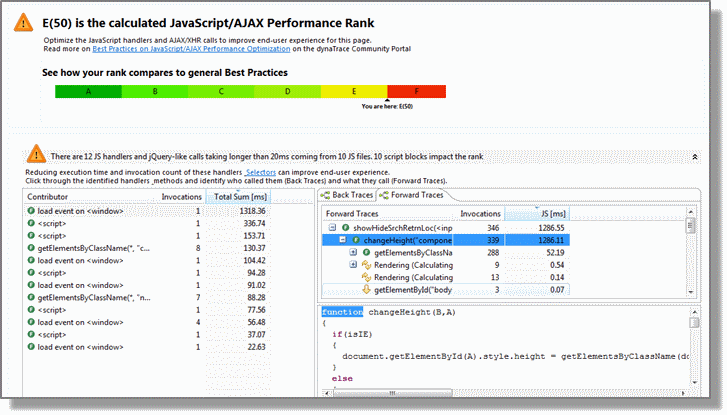
Here we find all JavaScript code pre-analyzed to reveal its performance characteristics. All JavaScript blocks which execute for more than 20ms are shown as well as invocations to jQuery and prototype selectors. Using back traces we can find the functions using expensive selectors. Forward traces help to figure out why a certain JavaScript handler takes long to execute.
Challenge: My boss wants me to monitor the performance of all our test cases. Can I do this in a reasonable amount of time?
Continuously monitoring tests helps to detect regressions easily and see trends in performance during development. Many people, however, hesitate to do this as they think it will cost them a lot of time to set it up.The easiest way to get started is by converting your functional web test to performance tests. If you already have automated functional tests you only need to configure them to automatically track performance metrics and make dynaTrace send it to a defined JSON endpoint. The data you get provides all major performance metrics as shown below:
{
"version":"2.0.0",
"url": "www.mydomain.com",
"rank":95,
"ranks":{
  "cache": {"rank":100, "comment":"" },
  "net": {"rank":98, "comment":"" },
  "server": {"rank":94, "comment":"2 dynamic server-requests" },
  "js": {"rank":89, "comment":"4 slow JS handlers"}
},
"timetoimpression":1587,
"timetoonload":1645,
"timetofullload":2747,
"reqnumber":9,
"xhrnumber":0,
"pagesize":264562,
"cachablesize":0,
"noncachablesize": 264562,
"timeonnetwork": 400,
"timeinjs": 30,
"timeinrendering":200
}
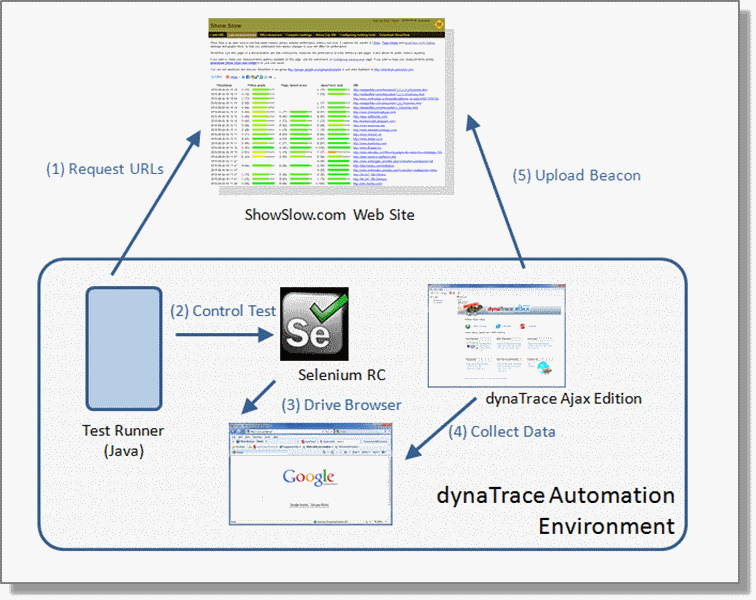
A real world example of following this approach is the automated performance testing we do for our benchmarking and also for providing information to ShowSlow. We test a reasonable amount of web sites (around 6000) using Selenium and then upload the data to the public ShowSlow endpoint.
Automated tracking of your performance tests therefore is fairly easy and all tools you need are available for free. The tools are also readily integrated that you only have to take care of the test cases
Challenge: My pages stay blank for a very long time. … and it does not only happen with IE6
Page Load Time optimization is central for ensuring end-user satisfaction. The most commonly used approach is to work with waterfall charts. They do a pretty good job finding network related problems. It might get tough,however, if you want to find JavaScript-related problems. If you are downloading a lot of resources – ok I know this should not happen – you might have problems figuring out which JavaScript execution caused the problem.
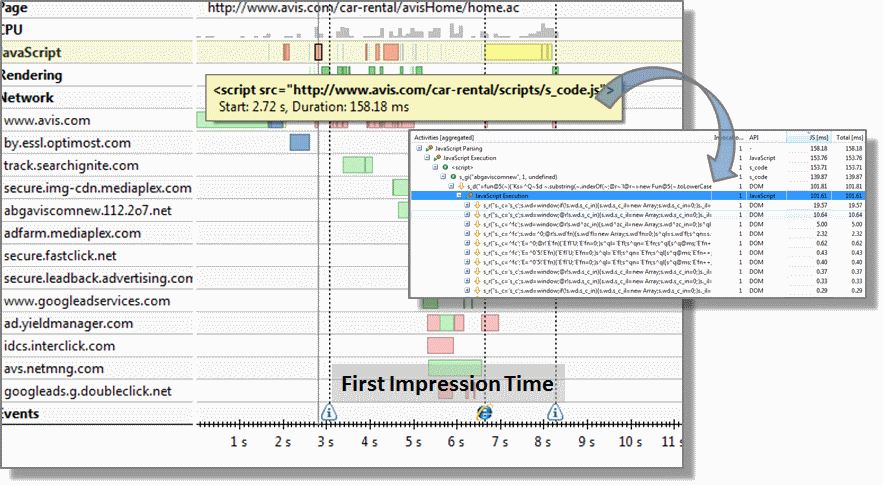
The timeline view provides a holistic picture on browser activity. It compactly shows downloads per domain, revealing the details when you hover over the time line, as well as details on rendering and JavaScript execution times. A double click will then directly take you to the executed JavaScript code. The easiest way to analyze why your first impression time is high is to select the timeframe from the download start to the First Impression time event and analyze the parts which blocked rendering.
Challenge: I love all these detailed information I can get, however I want to get some high level metrics first. Can I avoid these grades as I already did not like them at school?
Figuring out where to optimize a page is most commonly done by evaluating it against rules which validate your site against best practices. Sometimes,however, you are confronted with a concrete problem and want to figure out what caused this specific problem. You are therefore not interested in general optimization hints, but rather want to know why your page suddenly is slow and see which parts got slower at a glimpse.
The KPI tab in the performance report provides exactly this information. It visualizes the most important metrics in a single screen that provide exactly the information you need to analyze and track down problems. As you can see in the screenshot the problem here is definitely related to some networking problems.
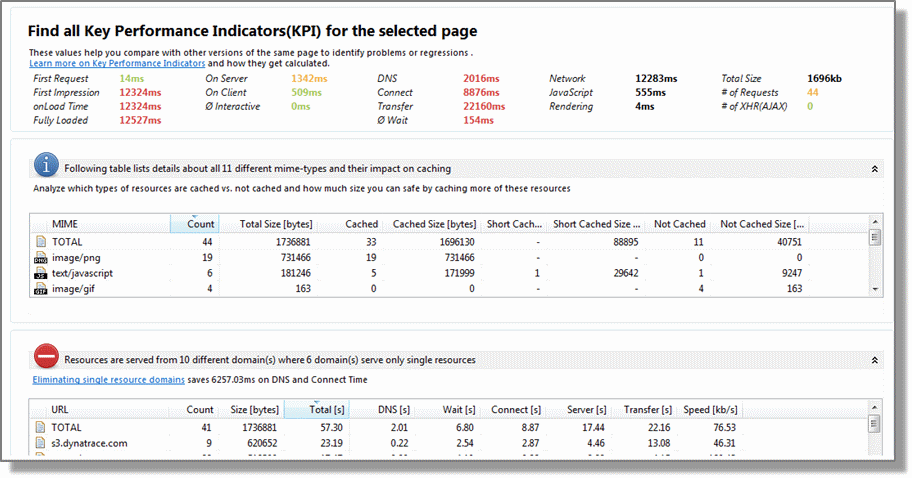
Working with these KPIs makes a lot of analysis tasks much easier – especially if you need a global picture of what is going on summarizing network, JavaScript, page content and content delivery metrics.
Challenge: I have a flickering screen and enormous CPU usage. This seems to be a rendering problem. Now we are at rocket science, right?
Analyzing and optimizing rendering behavior can become a quite challenging and time-consuming task. I just had a conversation with a guy who spent one week optimizing the rendering behavior of a web site. Identifying the cause of rendering issuesoften seems to be like solving a complex puzzle and requires a very detailed understanding of browser internals.
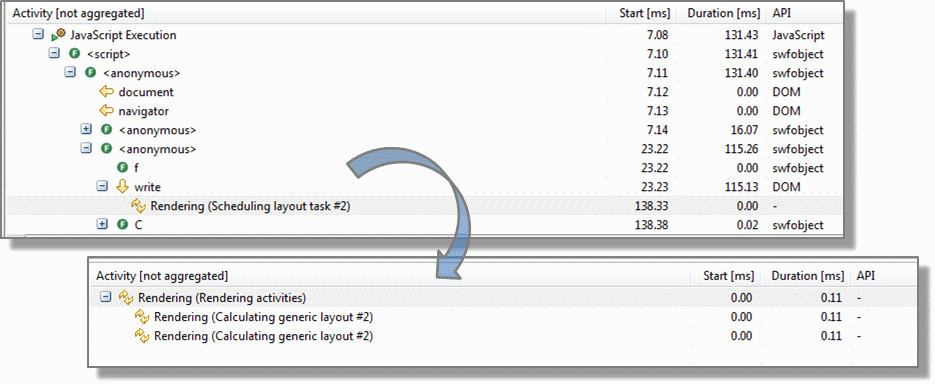
The good news is that there is also an easy approach to find the cause of these problems. First you search for rendering and layouting activities in the PurePath view. For every layouting event you get information which element it is performed on. This is the number shown which identifies the element internally for the browser. As soon as we know which element forced layouting we simply search previously executed JavaScript code that scheduled layouting for this specific element.
Conclusion
Web performance analysis is getting easier and easier. A lot of tool providers invest in exactly that – making peoples’ lives easier. Most of the tools are also free and the community is working together to build more and more integrated solutions. Things that sounded like rocket science just a year ago can today be performed in a couple of minutes.