

Patrick Meenan (@patmeenan) created WebPagetest while working at AOL and now works at Google with the team that is working to make the web faster.
Back in 2008 I took a look at all of the pages that had been tested on WebPagetest to get an idea of how things looked (both from a performance perspective and at how well optimized pages were in general). It was pretty eye-opening and showed that there was a LOT of room for improvement. Here we are, two and a half years later with significantly increased focus on web performance, have things gotten any better? I went and pulled the last 6 months of test data from WebPagetest for both IE7 and IE8 and also brought back the data from 2008 to compare.
Methodology
Just a really quick word on what we’re looking at before we dive into the results. The data is all from testing done at the Dulles, VA location (the default test location) and only one data point for any given unique URL is used (the most recent successful first-view test for a given URL). There were roughly 100,000 tests (unique URLs) in the 2010 IE7 data set, 20,000 tests in the 2010 IE8 data set and 25,000 tests in the 2008 IE7 data set. No attempts were made to only select URLs that were in all 3 data sets. This is also not a neutral set of pages (like a Top 500 list) so there should theoretically be a skew towards pages where people were explicitly looking at or working on the performance of the site (though all of the Top X pages are included in the data set as well because during the time periods there were several bulk tests with controlled URL sets focused on Alexa, retail, etc).
So, enough with the background and on to what you came here for…
Metrics
Page Load Time
First up is the overall Page Load times. This is a measurement of the time from when the user first tries to navigate to a pageuntil the onLoad event fires (all of the content and images finish loading).
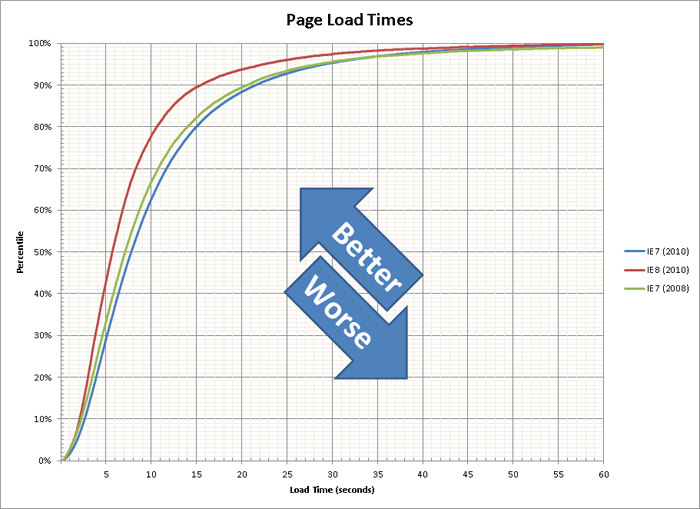
We’re not off to a very good start. Over the last 2 years pages have actually gotten a little slower (~3/4 of a second slower for the median). IE8 broke new ground in the browser war by focusing on improving the performance of loading pages (and not just focusing on JavaScript execution speeds) by introducing non-blocking loading of scripts (all of the other modern browsers have since picked up the same technique – the browser wars are great for spreading innovation). IE8 also increased the number of parallel connections per host name from 2 to 6 which brings it on par with the other major browsers. Don’t bet on browser-level improvements to be able to make up for slower pages though, IE8 was a one-time large success and there are already initial indications that IE9 will not offer additional improvements in this area.
Start Render Time
Next up is the start render time. This is the amount of time between when the user starts to navigate to a page and the first time they are looking at something other than a completely white page. This doesn’t necessarily mean the content has loaded as it can sometimes be just a CSS background color or image but it is guaranteed that no content was visible before this.
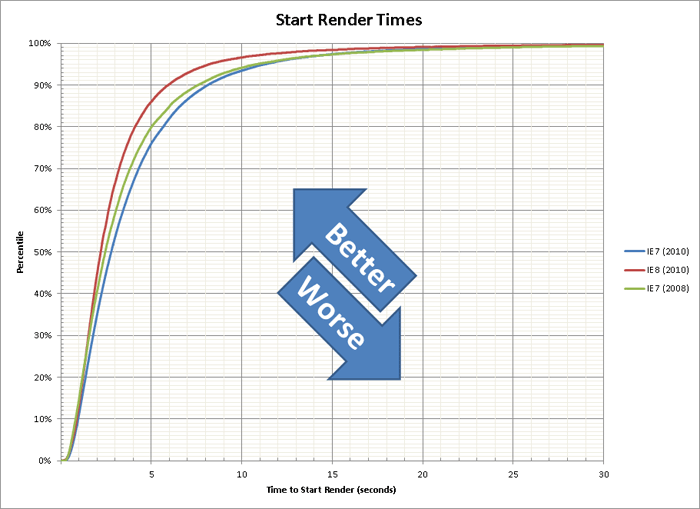
Again, things are getting slower (and we see IE8’s non-blocking JavaScript loading at work). The really scary part is that for 50% of the pages the user is staring at a blank screen for at least 2.5 seconds. As Edmunds has shown, for sites that focus on performance you can usually get your entire page load time in under 2.5 seconds so displaying a blank screen for that long is NOT a good user experience. I feel particularly bad for the users visiting the 5% of sites that take over 10 seconds to display anything (assuming they still have users).
Page Size (bytes)
The Page Size measurement is the number of bytes downloaded over the Internet to load the page.
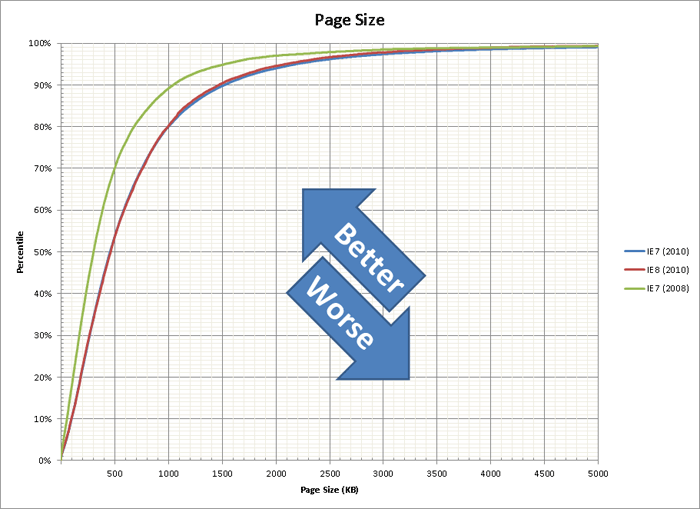
Pages got substantially heavier from 2008 to 2010 (around 150KB heavier at the median).The really scary part – 20% of pages are over 1 MB and 10% are even over 1.5 MB, YIKES! It is good to see that the IE7 and IE8 lines are basically righton top of each other which shows that even with the different sample sizes the distribution of URLs is pretty similar between both data sets.
Number of Requests
The last metric we’re going to look at is the number of requests that make up the pages (images, css, JavaScript, etc).
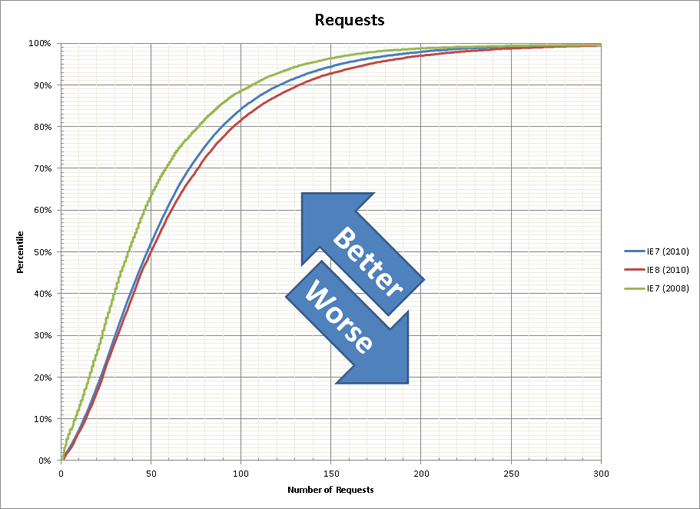
Just like with the page weight, the pages also made significantly more requests in 2010 than they did in 2008 (10 additional requests at the median). As we add more and more third-party widgets to our pages this will continue to get worse and has a pretty big impact on the performance of pages. The 15-20% of pages with over 100 requests is also pretty scary.
Basic Optimizations
So, now that we know how things are performing let’s see how well optimized the pages are. We’re going to look at what I consider to be the most critical optimizations (until you have implemented all of these you shouldn’t be looking at anything else and there is no reason in this day and age that sites shouldn’t be doing these).
Keep-Alive
Keep-Alives are one of the most basic optimizations and simplest to implement (it’s just a server configuration setting – no changes to code at all). Connection Keep-Alive re-uses a TCP connection for multiple requests from a given domain and without it each request needs to make an additional round-trip to establish a connection (and the round-trips are what kills you for performance). Enabling keep-alives for a sitethat has them disabled can cut the load time almost in half (which is a HUGE return given the time it takes to fix the server configuration).
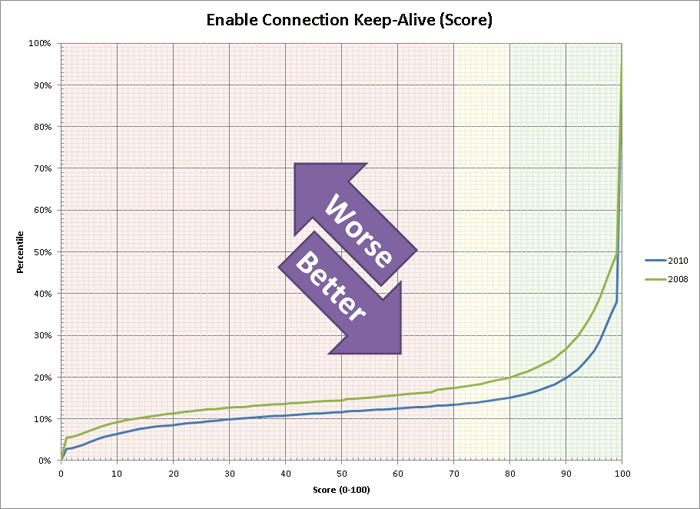
The good news is that things got better from 2008 to 2010 with 62% of sites now leveraging keep-alives for all of their requests (and 85% of sites getting a passing grade). The bad news is that there are still 12% of sites that get a failing grade on the most basic of optimizations. If you’re using a shared hosting provider that will not enable keep-alives – MOVE! If your CDN provider tries to convince you that you don’t need it, get a better provider! And if your ops team can’t figure out how to get it working they should be fired! In a lot of cases it is unintentional because of an old Apache configuration for SSL that breaks keep-alives for IE (it should target only IE4 and below but targeted all of IE).
Text Compression (GZip)
GZip compressing your text resources (html, JavaScript and css) is another one of those trivial optimizations that can have a big win. It will significantly reduce the size of the resources as they transfer over the network and there’s even a good chance it will save you money if you pay for your bandwidth usage. Again, it’s usually just a server configuration and you don’t need to make any changes to the content to enable it. Everyone’s favorite poster child for this optimization is cnn.com where they serve close to 1 MB of text resources without compression for their home page and it can be cut down by 2/3 just by turning on compression.
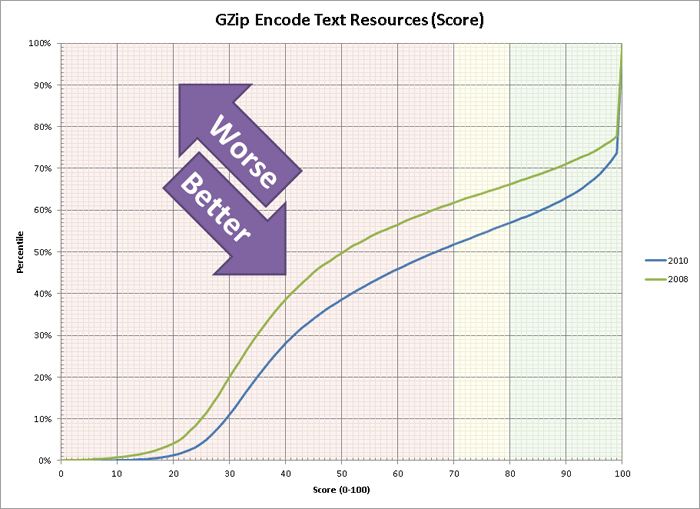
Again, we see an improvement going from 2008 to 2010 but there are still less than 45% of pages that get a passing grade (and “passing” is pretty liberal here because a score of 80 means you could have saved 20% of the weight of your text resources by enabling compression). Hard to believe that for something that is so trivial to implement we aren’t seeing better scores (and that even sites as prominent as cnn.com are failing).
Image Compression
Similar to the GZip optimization check, the Image Compression check sees how much of the page size you can save by “properly” compressing images. This usually comes in the form of being more aggressive with your jpeg images and compressing them so they are smaller (but still look the same). It is not unusual to find photos whose size can be cut in half by better compressing them. This does take a little more work because you have to put the proper processes and guidelines in place in your publishing process but it’s still relatively easy to implement and doesn’t involve any radical surgery on your site.
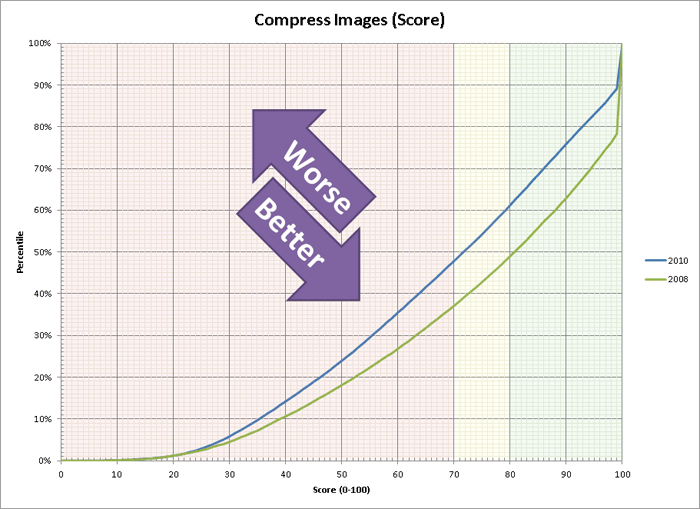
Breaking the trend, here we see things actually got worse going from 2008 to 2010 with a full 10% fewer pages getting a passing grade.
Cache Static Content
Caching of static content just means that you’re letting the browser’s cache do it’s thing and store files that don’t change instead of requesting them every time the user comes back to your site. To do it right you need to set an expiration date on the resources that tells the browser to keep it and re-use the cached version (we check to make sure it is at least 30 days but longer is even better). This doesn’t mean letting the browser re-validate resources and serving 304’s – that takes just about as long as downloading the content in the first place. This can have an ENORMOUS impact on making pages faster for someone coming back to your site or even navigating across multiple pages. It can be a bit tricky to implement because you usually need to add version numbers to your resources but it is well worth the time.
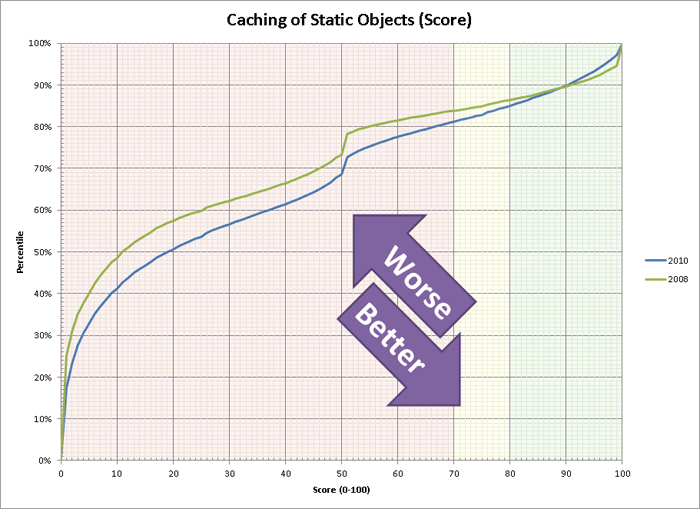
Things got marginally better from 2008 to 2010 but things on the caching front are still pretty dismal. Only 15% of pages get a passing grade with ~18% of sites failing completely (as in a score of 0, not just an F).
Combine JS/CSS
Combining of JS and CSS files into as few as possible of each (optimally just one css and no js) before start render can have an enormous impact on the perceived (and real) performance of your page. Browsers prior to IE8 will block when loading JavaScript and load only one of them at a time. Here again cnn.com is the poster child we use when looking at how NOT to do it with 13 JavaScript files and 4 css files.
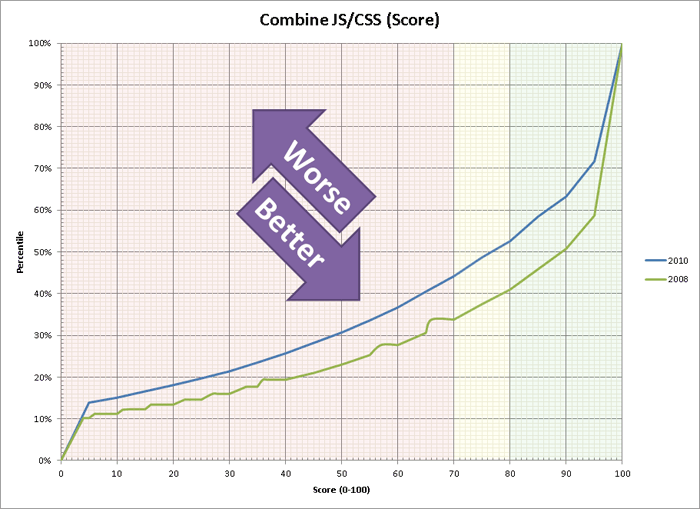
Here we find another case where things are getting worse going from 2008 to 2010. I expect this is largely because of more and more widgets and third-party content being added to sites and because everyone is using the “easy” implementation of just adding the code to the head of the page. Google Analytics did a great job blazing the trail for good implementation code that is non-blocking – we just need all of the widget makers to pay attention and follow suit.
Content Distribution Network (CDN) Use
The final check is a more controversial one and is the only one that I consider optional, depending on the distribution of your customer base. If all of your customers are in the same region (like within a few hundred miles) where your web server is then you can get by without using a CDN. If your customers are spread out any further than that (and particularly if you target the Internet at-large) I highly recommend using a CDN. Fundamentally, once you have done a lot of optimizing to your site your limiting factor will usually be the round trip times from the user to your web server (which will largely be limited by the speed of light and isn’t getting any faster). A CDN brings your static content closer to the users and reduces that time. It might not be something you notice if you are close to your server but someone half-way around the world will see a huge improvement. I usually recommend saving this for last after you have done all of your other optimizations (including things we don’t check for like image sprites) because a CDN can hide a lot of sins by reducing the time for each request.
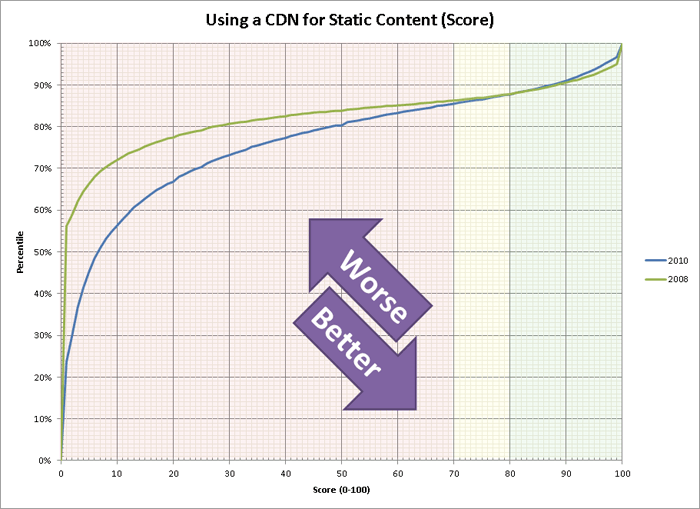
In 2010 it looks like things are getting better on the low end of things but scores of 70 and higher are right on top of each other. This is probably caused by the adoption of third-party widgets on pages where the widgets are being served by a CDN but the pages themselves are not. It’s pretty sad that in this day and age of inexpensive (and even free) CDN’s only 15% of pages get a passing grade.
Final Words
I must say that I’m a little bit disappointed by the progress over the past two years. There have been some small incremental gains but they have also been offset by larger, more complex pages. There is only so much that the browsers themselves can do to make things faster and with round trip latencies usually being the limiting factor you will not see faster computers or connectivity helping either. We are starting to see more solutions that transform pages on the server side to make things faster (as well as new protocols like SPDY). If we can get broad adoption on the server side of things hopefully you’ll see things start to materially improve.