

Buddy Brewer (@bbrewer) is a co-founder of Log Normal, a company that shows you exactly how much time real people spend waiting on your web site. He has worked on web performance issues in various roles for almost ten years.
Navigation Timing is an API from the W3C’s Web Performance Working Group that exposes data about the performance of your web pages. Navigation Timing is a major new development because it enables you to collect fine-grained performance metrics from real users, including events that happen before Javascript-based trackers have a chance to load. This gives us the ability to directly measure things like DNS resolution, connection latency, and time to first byte from inside the browsers of real users.
Why you should care
I spent the first eight years of my career building synthetic monitoring products but I now believe real user monitoring should be your preferred source of “The Truth” when it comes to understanding the performance of your site. That doesn’t mean you should throw away your synthetic monitoring, but today I view it as a useful complement to real user monitoring rather than a complete performance solution in itself.
Real user monitoring is critical because it provides the most accurate portrayal of the true experience across the browsers, locations, and networks your users are on. It is the only way to realistically measure how your caching decisions impact the user experience. Measuring real people (with real personalities and real credit cards) also gives you an opportunity to collect performance and business metrics in the same context, so you can see what impact load times are having on key business metrics like conversion and bounce rates.
The biggest problem we face with Navigation Timing is that there isn’t a good system for collecting and analyzing the raw data. In this post I’ll describe a solution to this problem that can be quickly deployed using free tools.
Collecting Navigation Timing timestamps and turning them into useful measurements
The window.performance.timing object gives all of its metrics in the form of timestamps relative to the epoch. In order to turn these into useful measurements we need to settle on a common vocabulary and do some arithmetic. I suggest starting with the following:
function getPerfStats() {
  var timing = window.performance.timing;
  return {
    dns: timing.domainLookupEnd - timing.domainLookupStart,
    connect: timing.connectEnd - timing.connectStart,
    ttfb: timing.responseStart - timing.connectEnd,
    basePage: timing.responseEnd - timing.responseStart,
    frontEnd: timing.loadEventStart - timing.responseEnd
  };
}
This gives you a starting point that is similar to the waterfall components you commonly see in synthetic monitoring tools. It would be interesting to collect this data for a while and compare it to your synthetic data to see how close they are.
Using Google Analytics as a performance data warehouse
Next we need a place to store the data we’re collecting. You could write your own beacon service or simply encode the values on a query string, log them in your web server’s access logs, and write a program to parse and analyze the results. However these are time consuming approaches. We’re looking for something we can get up and running quickly and at minimal cost. Enter Google Analytics.
Google Analytics is the most popular free web site analytics system on the Internet. While GA automatically provides basic performance metrics in its Site Speed Analytics Report, it is based on a sample of data and only reports on the total page load time. We can improve this by using GA’s event tracking capability to store and analyze our fine-grained Navigation Timing metrics:
window.onload = function() {
  if (window.performance && window.performance.timing) {
    var ntStats = getPerfStats();
    _gaq.push(["_trackEvent", "Navigation Timing", "DNS", undefined, ntStats.dns, true]);
    _gaq.push(["_trackEvent", "Navigation Timing", "Connect", undefined, ntStats.connect, true]);
    _gaq.push(["_trackEvent", "Navigation Timing", "TTFB", undefined, ntStats.ttfb, true]);
    _gaq.push(["_trackEvent", "Navigation Timing", "BasePage", undefined, ntStats.basePage, true]);
    _gaq.push(["_trackEvent", "Navigation Timing", "FrontEnd", undefined, ntStats.frontEnd, true]);
  }
};
The code above fires five events to transmit our five performance measurements. We are waiting until the load event to ensure we get a valid measurement of the front end time. If we weren’t concerned with front end performance, we could fire the events at any point during page load. The final true parameter in each call is important to ensure the events don’t get misinterpreted by Google Analytics as user interactions, which would skew bounce rate calculations.
For more information see the Google Analytics Event Tracking Guide.
Reporting on performance in Google Analytics
Now that we’ve collected our Navigation Timing data in Google Analytics, it’s time to run some reports. Log into Google Analytics and click Content – Events – Top Events. Click on Navigation Timing under the Event Category list and GA will display a table showing the number of measurements and average value for each of our five performance dimensions. This view will also let you plot the average value of any of the five dimensions over time.
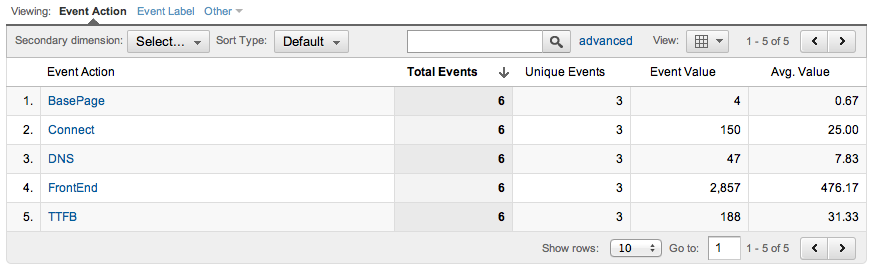
Example Google Analytics Report
Limitations
This approach has the advantage of being quick to set up using freely available tools and techniques. But as with most things that are fast and cheap, it has a few shortcomings:
Lack of browser coverage. Navigation Timing isn’t yet available in Safari (desktop or mobile) and obviously won’t be available in legacy versions of browsers that will be around for some time to come. Testing with a subset of browsers is probably fine for measuring conditions before the page starts getting parsed, but when you begin looking at front end performance the lack of data from certain browsers has a bigger impact.
No object level data. Synthetic monitoring still rules the roost here. The W3C Resource Timing specification promises to provide object level data from real users in the future, but as of this writing it isn’t available in any popular browsers.
Limited to the capabilities of the Google Analytics reporting system. With Google Analytics, you have to take what you’re given. You can generate and plot averages of measurements, but you won’t get percentiles, degradation alerts, or many other features you are accustomed to seeing from performance monitoring tools.
Final thoughts
Now that Navigation Timing is available in the top three browsers, everyone should have some form of real user monitoring in their performance tool box. The approach outlined above isn’t perfect but it gives you a basic level of coverage at no cost and minimal effort.
My company, Log Normal, is building a premium real user monitoring solution that aims to give you the best possible insight into real user performance. If you’re interested in learning more, head over to our web site and request a beta invitation.