

Patrick Meenan (@patmeenan) created WebPagetest while working at AOL and now works at Google with the team that is working to make the web faster.
There has been a fair amount of research that tells us that 80-90% of the time spent loading web pages is spent on the “front-end” (browser pulling in external resources like css, javascript and images) and only 10-20% of the time for a typical page is spent on the back-end. While that is true “in general”, and there are a lot of tools that focus on giving you suggestions on improving your front-end code (WebPagetest, Page Speed, Y-Slow), it is not uncommon to see back-end performance issues, particularly as you move away from the top Internet sites into the long tail of the Internet.
This is not entirely unexpected because the top sites tend to have dedicated developers who custom-built the back-end code for serving pages and have dedicated operations teams that watch the performance of the systems and databases and spend a lot of time focused on the performance and scalability of the back-ends.
As you move out of the top tier of Internet publishers you start running into sites that are running on off-the-shelf content systems (Drupal, WordPress, Joomla, etc) and with owners who either contracted for the site development at one point in time or used and tweaked an available template and then used a collection of plugins to put together their site (often not knowing how the plugins themselves work). The hosting for these sites also varies wildly from dedicated servers to VPS systems to running on shared hosting (by far the most common) where they have little to no insight on the performance of the actual systems their site is running on.
As a result, it’s not uncommon to see something like this:
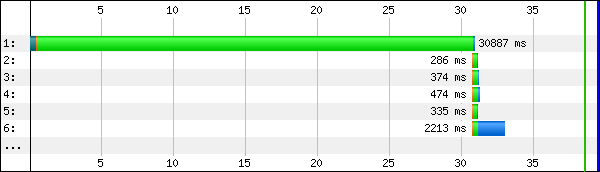
Yes, that is a 30+ second time to first byte (TTFB) with all of the time being spent somewhere on the back-end to assemble and produce the page. This wasn’t an outlier either. For this page, EVERY page load takes 30+ seconds before the browser even gets the first bit of HTML to work on.
This isn’t unique to this site or the Content Management System (CMS) it runs on (though it is an extreme example). It is not uncommon to see 8-20 second back-end times from virtually all of the different CMS systems.
This is really painful for users (assuming any of them actually wait that long for the site) but it also causes scaling problems for the back-end because the application is tied up for a long time processing each request making fewer resources available for other users.
What is a good back-end time?
A good target for just the processing time for back-end requests is on the order of 100ms (0.1 seconds). That doesn’t mean you should expect a TTFB of 100ms, just that the back-end processing time shouldn’t take longer than that. It is important to remember that the user can’t see ANYTHING at all before the TTFB so any improvements there go directly to the user experience.
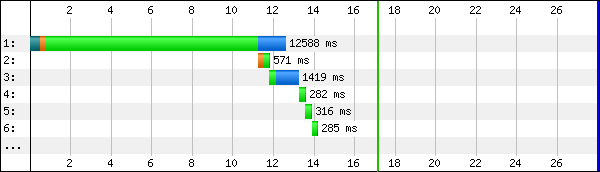
When figuring out the back-end time from a front-end tool like WebPagetest, you need to remember to include the network latency. For that I usually use the socket connect time to the server (orange bar) as the RTT and then use that as a baseline for everything else.
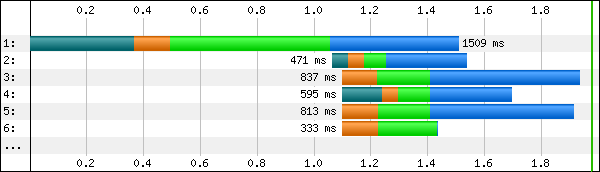
In this case, the DNS lookup time (teal bar) is taking longer than I would expect but you want to compare the size of the orange bar to the size of the light green bar. The length of the orange bar is the fastest the server would be able to reply and assumes 0 back-end processing time so if they are reasonably close in size then you’re in pretty good shape.
Eyeballing waterfalls is good for a general feeling but if you want to see the specifics, you can get the individual component times in a data table below the waterfalls on WebPagetest:
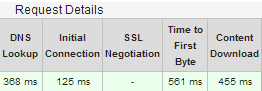
In this case you just subtract the initial connection time from the TTFB and you have the amount of time that was spent on the back-end (436ms here).
Figuring out what is going on
So, you know you have a back-end issue, how do you figure out what is causing the problem?
The problem is almost certainly caused by one of these issues:
- Web server configuration that is out of available clients to process requests
- Slow database queries
- Back-end calls to external services
Unfortunately, most of the performance tools you are used to using don’t have any visibility into those components and they become a black box. At this point you need a developer and a sysadmin (or someone with the skillset to do both) because fixing it is going to involve code or site configuration changes. Even just finding the source of the problem requires a pretty decent skillset.
There are commercial solutions that will identify the issue for you really quickly with minimal work. Actually, there is a whole sector focused on it (called Application Performance Management or APM). I’ll use New Relic as an example here because it is what I use on webpagetest.org but Dynatrace is another common solution. All of them require that you install binary code on the server though so if you are on shared hosting these may not be available options (and once you get through the free trial phase most cost more than shared hosting plans anyway).
Once configured, the APM tools will monitor your production systems and tell you how much time your server is spending in the various different tiers:
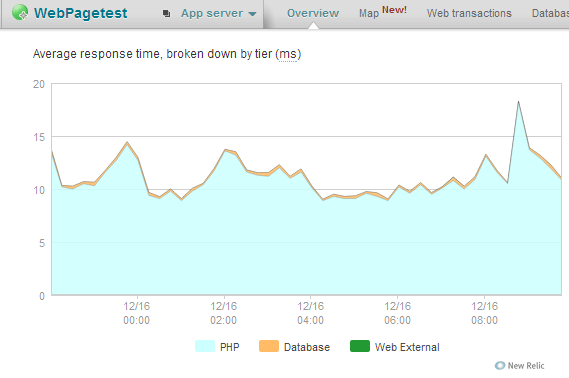
I’ve done a fair bit of tuning to WebPagetest so there’s not a whole lot to see here. Average response times are ~10ms and the database is only used for the forums so the bulk of the time is spent in the actual application code.
From there you can drill into each band to see exactly where that time is going:
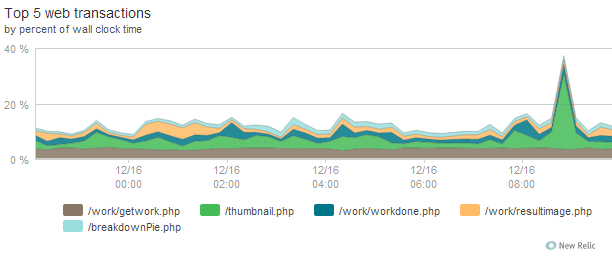
In my case, most of the CPU time is spent generating thumbnail images (which includes waterfall thumbnails) for the results pages. Not completely unexpected since they are all generated dynamically by code.
The thumbnail generation is something I spent a fair amount of time optimizing because it used to be a LOT more resource intensive and took close to 80% of the time. The tools let you keep drilling in to see what specific functions contribute to the time:
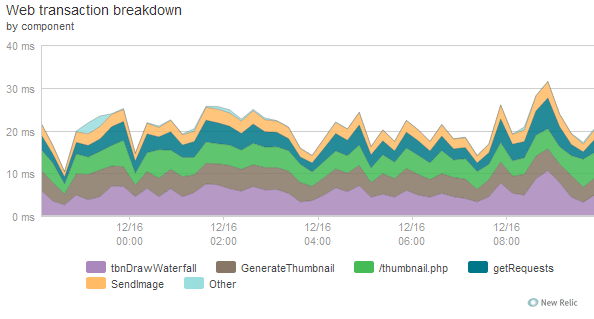
They let you do the same for database calls and for particularly slow requests they will provide diagnostics for individual requests instead of just aggregate results so you can also drill into slow outliers easily.
If you aren’t fortunate enough to be able to use the tools then you have to look into what is available for your platform to see if there are free diagnostic tools or you have to start instrumenting the code yourself. In WordPress, for example, there are several plugins that will debug the database queries and tell you how long they are taking.
W3 Total Cache is a useful plugin for improving WordPress performance but it also provides debugging information that will help you identify any slow database calls:
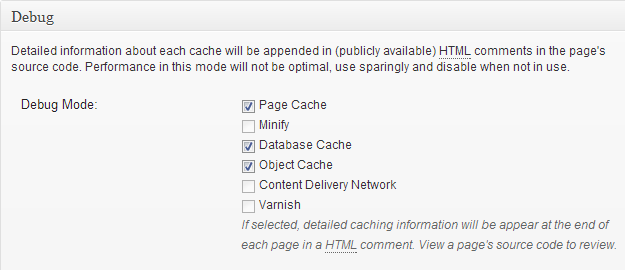
When you enable the debug information, details about every database query (and cache operation) will be logged into the page HTML as a comment that you can view by visiting the page and viewing the page source:
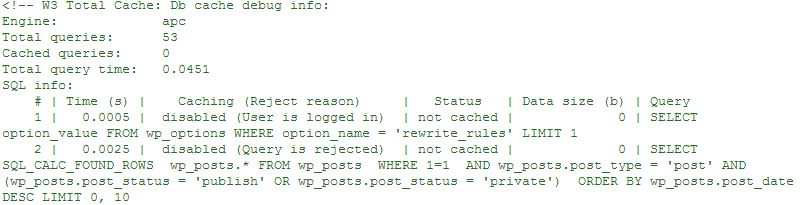
You’ll get the overall time spent in database queries as well as timings and details for each and every query.
Fixing it
Great, so now that you’ve identified the issues the real hard work starts. The most common “solution” people use is to add caching to hide the problem. This can be in the form of a plugin like W3 Total Cache that will let you cache all sorts of different operations to custom query caches using memcache. Caches are absolutely necessary but you should improve the underlying issue as much as possible before enabling caching, that way 100% of the requests will get improved performance.
Finally
As they say in carpentry, measure twice, cut once. Don’t go optimizing your site until you have measured the user experience and then use the measurements to guide your work, not grades or scores from various tools ñ they may not be relevant to your particular situation. Just because sites normally spend most of their time on the front end doesn’t mean that is necessarily the case for yours.