

Fiddler’s Performance Roots
In 2003, I began developing the Fiddler Web Debugger to help debug client-server interactions between Office 2003 and the Office Online website. At first, my goal was to simplify functional testing, but when the Office Online website went live, we immediately found we had major performance issues, and Fiddler was soon pressed into service to help analyze these problems.
Our website suffered from numerous backend scalability problems, but we found that even when the site was under light load, page load times were nowhere near our goals. The problems were myriad�”the site wasn’t using compression in enough places, most resources weren’t cacheable, and pages often used dozens of small resources from multiple different domains. A misunderstanding of ASP.NET postbacks led to uploading ~100kb of uncompressed data when users clicked the “Terms of use” checkbox�”an upload operation that could take multiple seconds on then-common DSL connections, and (torturously) even longer on a modem.
Using Fiddler, the team began discovering and attacking each of these problems, and I soon had a long queue of feature requests to enhance Fiddler’s usefulness as a performance-optimization tool.
Measurement vs. Optimization
I’m often asked “How do I measure my site’s page load performance using Fiddler?” My typical answer is “You’re using it wrong. Use a stopwatch to measure time; use Fiddler to learn how to make your site faster.“
Fiddler operates as a proxy server between your client and the websites you’re testing. As a consequence, it must be recognized that Fiddler introduces Observer Effects, whereby the observed performance can differ from the real-world performance due to the measurement tool alone. This was particularly true in the dark days of IE6 and IE7, where WinINET limited the connections-per-proxy to two.
Now, that’s not to say that performance measurements with Fiddler are invalid�”simply that they must be considered in the appropriate context. For instance, some percentage of a site’s visitors will be behind a proxy server of some sort, and most sites’ visitors have a broad range of bandwidth, latency, and CPU performance.
For most web developers, the measurement limitations of debugging proxies are not very important�”the optimization opportunities you can discover with Fiddler are usually orthogonal to observer effects that affect measurement. For instance, Fiddler reliably shows request and response size, caching directives, compression information, socket reuse, and myriad other crucial information for performance optimization.
Use the Platform
Even as I raced to add features to Fiddler to better meet my team’s needs, I recognized that there were many scenarios (e.g. security testing, content archiving, behavioral logging, prototyping) where I couldn’t possibly keep up with the feature requests. As a consequence, I invested heavily in architecting Fiddler as a platform, where the full power of Fiddler was exposed to developers using both scripting (FiddlerScript is based on JScript.NET, an ECMAScript dialect) and .NET assemblies written in C#, VB.NET, or any .NET language. Subject-matter-experts have built and shared a number of powerful extensions atop Fiddler, and many teams have built lightweight bespoke add-ons to address their own scenarios.
For example, the Microsoft ACE team built neXpert, a Performance-best-practices analyzer which generates a report of how closely your site adheres to common best-practices.
A number of years after Fiddler was first released, there were a flurry of requests of the form: “How do I put Fiddler inside my automated test harness or application… with none of the UI?” These requests led to the release of FiddlerCore, a class library that can be used to integrate the core functionality of Fiddler into any .NET application. Some consumers of this library use it to maintain a daily database archive of the metrics for their site (e.g. page weight, resource/domain count, etc) so they can understand how their site’s key performance metrics have evolved over time. At Telerik, we use this library to capture test cases for TestStudio, our functional and load testing suite.
Interoperability
While I was (and remain) eager to encourage the community to build atop the Fiddler object model, I recognized that developers have many tools in their toolboxes, and no tool should be an island.
Fiddler includes a rich Import/Export model that enables interop with other web tools. Fiddler can import and export traffic captures in the standard HTTPArchive format as well as the XML-based variant exported from IE9 and IE10. You can also easily export HTML5 AppCache Manifests to simplify your site’s adoption of this performance-enhancing technology.
Tool developers can easily build and share their own importers or exporters, or adopt the simple SAZ Format that Fiddler natively uses to losslessly store web traffic.
Improve Performance with 10 Fiddler Tricks
Fiddler is a useful tool in many performance-optimization scenarios. Following are 10 tips that will help get you started.
1. Work with DataURIs
DataURIs allow you to embed small resources directly within your page. Unfortunately, as long strings of base64-encoded binary, these resources can be somewhat more difficult to work with than the individual resource files they replace.
With Fiddler, you can copy a DataURI to your clipboard (from Fiddler itself, or anywhere else):
Then use the Edit > Paste Files as Sessions command to instruct Fiddler to parse the DataURI and create a new Session for it:
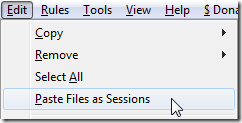
You can then use Fiddler’s Inspectors to examine the resulting object:

You can also easily create new DataURIs with Fiddler. Simply right-click one or more Sessions in the Web Sessions list and click the Copy > Response DataURI command on the context menu. The responses’ bodies will be encoded as DataURIs and copied to your clipboard. You can then inline these resources into whatever page you like.
2. Find Slow Pages with the Heat Map
Fiddler maintains a Timers object for each Web Session to enable you to understand how much time was spent on the request and response. You can easily visualize this timing data using the Time HeatMap checkbox inside the Response Time and Size section on Fiddler’s Filters tab.
When enabled, Fiddler sets a background color for each Session based on how long the server took to return a given response completely. Responses that take less than 50 milliseconds show in shades of green. Responses that take between 50 and 300 milliseconds are not colored. Responses that take between 300 and 500 milliseconds show in yellow. Responses that take more than 500 milliseconds show in shades of red.
3. Use the Timeline
By default, Fiddler’s Timeline tab shows a traditional waterfall chart to visualize the download of the Web Sessions you’ve selected. Each transfer line shows the start of the request and conclusion of the response. The small circles before the bar indicate whether the client and server connections were reused:
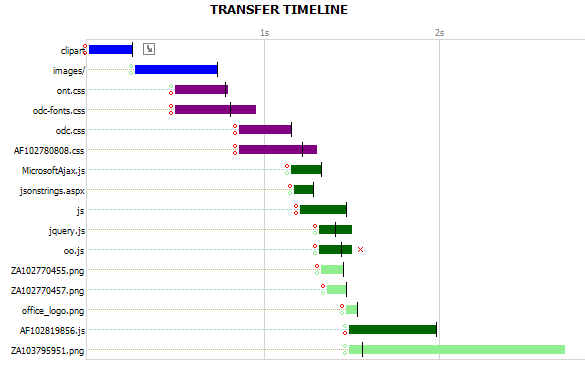
(Be sure to enable Streaming Mode when capturing, or you’ll find that your chart looks more like stair-steps than a waterfall.)
Beyond the default waterfall, Fiddler offers two other modes, Client Map and Server Map that allow you to visualize connection reuse between the client and the server, by displaying all transfers for a given connection on a single row. For instance, the following chart shows good connection reuse:
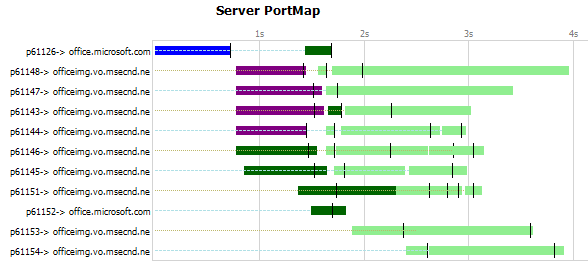
In contrast, if the server were misconfigured to close connections after each response, each row would show only one transfer.
4. Simulate Zero Network / Backend Time
Fiddler’s AutoResponder allows you to “play back” previously captured responses from within Fiddler. By unchecking the Enable Latency box, you can simulate an “infinitely fast” connection and server:
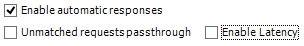
When so configured, Fiddler will immediately return a previously-captured response for every request from the client without hitting the network or the real server. In this way, you can determine the lower-bound for page load time�”your pages will never load faster than this!
If you find that your site isn’t meeting your performance goals with an infinitely-fast network, you will need to optimize your clientside code (JavaScript, DOM operations).
5. Expose Compression Information in a Column
Fiddler’s Web Sessions list exposes a great deal of information, but often you may find yourself wishing that it showed even more information. For instance, what if you’d like to easily see which responses were compressed?
There are many ways to add new columns to Fiddler, but for a simple scenario like this, the easiest is to just type the following command in the QuickExec box beneath the Web Sessions list:
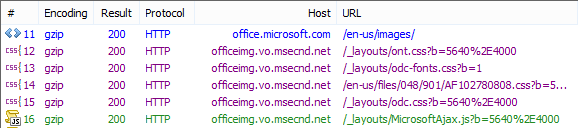
cols add Encoding @Response.Content-Encoding
After you’ve done so, a new “Encoding” column appears in the Web Sessions list. As new Web Sessions are captured, the column is filled with the contents of each response’s Content-Encoding header.
To fill in the new column’s rows for previously-captured Sessions, simply hit CTRL+A to select them all, then hit the F5 key.
6. Select Sessions Based on a Column’s Contents
Say you’d like to quickly get a list of HTTP Responses which are configured with a no-cache directive in their Cache-Control header. Simply right-click the column and choose Search this column….
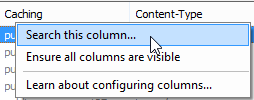
You can search using exact text, a regular expression, or greater-than or less-than expressions.
7. Use QuickExec to Find Sessions
The QuickExec box beneath the Web Sessions list is often the fastest way to find traffic that matches simple criteria.
- To select all responses greater than 25000 bytes, type:
>25kand hit Enter. - To find all responses that returned a status code of 404, type:
=404and hit Enter. - To find all requests targeted at a server with the text “ad.” in the hostname, type:
@ad.and hit Enter. - To find all requests that returned HTML, type:
select text/htmland hit Enter. - To find all requests that were sent with a no-cache pragma, type:
select @Request.Pragma no-cacheand hit Enter.
8. Beautify JavaScript
Minifying JavaScript is a performance best-practice, but crunched script can be very difficult to debug. You can use Fiddler’s JSFormat or SyntaxView extensions to quickly beautify JavaScript code for easier reading. For instance, this:
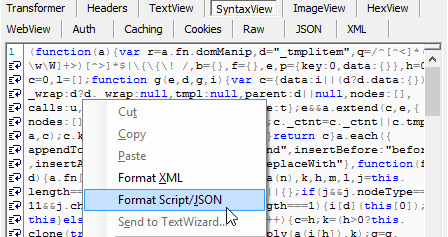
…can be formatted much more readably as:
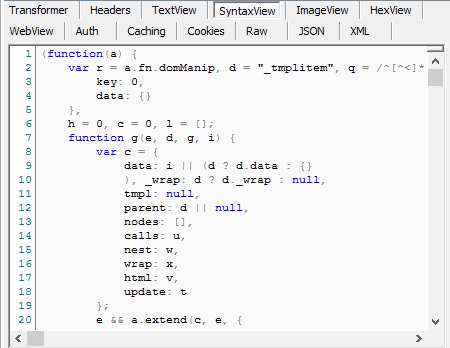
You have the option of simply formatting the script for display in Fiddler, or also formatting the script returned to the client (useful if you’re using an in-browser script debugger).
Alternatively, Fiddler can also replace script files entirely, on-the-fly. For instance, JQuery.js is available in both minified and debug versions. You can easily use Fiddler’s AutoResponder to replace the request for the minified version of the JS file with the debug version of the script. This way, you can easily debug your production site without slowing down performance for other users.
9. Leverage FiddlerScript Rules
On Fiddler’s Rules menu, you’ll find the following options:
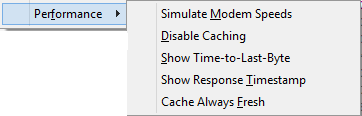
- Simulate Modem Speeds delays each outbound request and inbound response by throttling the rate at which content is written to and read from the network.
- Disable Caching removes all conditional validation headers from requests and rewrites all responses to
Cache-Control: no-cache. - Show Time-to-Last-Byte displays the number of milliseconds that it took to receive the entire response in the Web Sessions list’s Custom column. Similarly, Show Response Timestamp shows the timestamp at which the server’s response was completely received by Fiddler in that column.
- The Cache Always Fresh option will automatically respond to any conditional HTTP request with a
HTTP/304response indicating that the client’s cache is up-to-date, preventing the request to the server. You can use this option to explore the performance improvement of specifying a proper cache freshness lifetime.
These rules are implemented in FiddlerScript and can be easily viewed (and modified) by pressing Ctrl+R or clicking the Customize Rules… command on the Rules menu.
10. Write Your Own FiddlerScript Rules
Patrick Meenan mentioned that WebPageTest recently added a rule to check every uncompressed response and flag if a 10% savings would be realized if compression were present. You can easily do something like this in Fiddler.
Click the Customize Rules… command on the Rules menu to open the Fiddler Rules file. Scroll to OnBeforeResponse and add the following code inside that function:
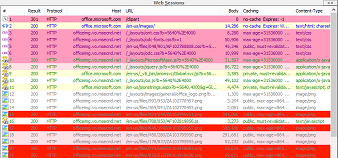
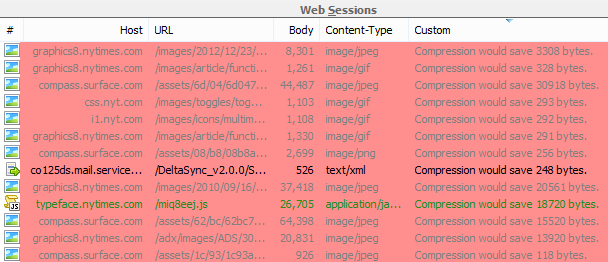
if (!oSession.oResponse.headers.Exists("Content-Encoding") &&
     !oSession.oResponse.headers.Exists("Transfer-Encoding") &&
     (null != oSession.responseBodyBytes))
{
     var iCurrentSize:int = oSession.responseBodyBytes.Length;
     var iCompressedSize:int =
         Utilities.GzipCompress(oSession.responseBodyBytes).Length;

     if (iCurrentSize > (iCompressedSize*1.1))
     {
         oSession["ui-backcolor"] = "#FF8E8E";
         oSession["ui-customcolumn"] = "Compression would save "
             + (iCurrentSize - iCompressedSize).ToString() + " bytes.";
     }
}
Now, as you navigate around the web, you’ll see Sessions flagged in red if the response body would be at least 10% smaller when GZipped:
What’s Next for Fiddler
Now that I’m working on Fiddler full-time for Telerik, I’ve had the opportunity to make some long-awaited tweaks and embark on some major new feature work.
This week, I’m working on full support for viewing/fiddling with HTML5 WebSocket messages. I’m also working on a CSS Beautifier (like the JS beautifier mentioned above) and tuning Fiddler’s own performance.
Up next, I’m hoping to get started on a much-improved bandwidth simulation module (with both better fidelity and more options than the current Simulate Modem Speeds option) while I work with the design team on an overhaul of the Fiddler user-experience. I’ll also be working to get Fiddler working even better across devices, especially mobile platforms (iOS, WindowsPhone, and Android).
Longer-term, there are two features I’m starting to think about: PCAP import (view your NetMon and WireShark-captured traffic in Fiddler’s UI), and SPDY capture. Support for SPDY is likely to prove especially tricky because the current version of the protocol depends on NPN, a TLS extension which is not currently supported by any version of Windows’ SChannel HTTPS stack.
What would you like to see next in Fiddler?