

As Steve pointed out in an earlier post, window.onload is not the best metric for measuring website speed. It is a convenient metric, and a familiar one, but it fails to capture the dynamic nature of most modern pages. Instead, we want to think about the user perceived performance of the page: how quickly can the user begin interacting with the page?
The definition of “interacting” will vary depending on your page. For some, this may be as simple as getting the text visible on the page, such that the user can begin consuming the information they requested (e.g. this page). For others, this may require wiring up dozens of JavaScript components to build up a JavaScript UI (e.g. Gmail). However, in both cases, there is one prerequisite: the user must be able to see the page, which is to say, the browser needs to render something to the screen.
So, with that in mind, what does it actually take to do a first content render in a modern browser?
DOM + CSSOM = Render Tree
The exact timing and behavior of the rendering pipeline will, of course, vary based on the parsing, layout and compositing pipelines of the browser. However, implementation differences aside, to get anything visible on the screen, all browsers must construct something resembling a “render tree”.
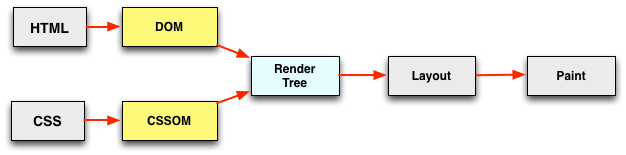
The parsing of the HTML document is what constructs the DOM. In parallel, there is an oft forgotten cousin, the CSSOM, which is constructed from the specified stylesheet rules and resources. The two are then combined to create the “render tree”, at which point the browser has enough information to perform a layout and paint something to the screen. So far, so good.
However, the diagram above shows an optimistic case: both the CSSOM and the DOM trees are shown as being constructed in parallel. This is where we must, unfortunately, introduce our favorite friend and foe – JavaScript.
- Synchronous JavaScript can issue a doc.write at any point; hence the DOM tree construction is blocked anytime a synchronous script is encountered
- JavaScript can query for a computed style of any object, which means it can also block on CSS
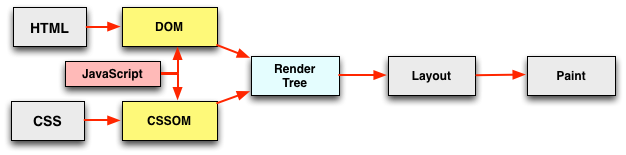
Instead of nice, parallel construction of the DOM and CSSOM objects shown in the earlier diagram, the two are now potentially intertwined: DOM construction can’t proceed until JavaScript is executed, and JavaScript can’t proceed until CSSOM is available. Yikes.
Depending on how this dependency graph is resolved on your pages, which is governed by how, and how many resources you include in that first “critical path” of the page load, the time to first render will vary accordingly. Can we get some metrics, or insights into this process? Turns out, yes we can!
Document Interactive & DOMContentLoaded
The HTML5 spec defines a well documented sequence of steps which the user agent must follow while constructing the page. Specifically, the end sequence captures two states, which can help answer our earlier question:
- The document is marked as “interactive” when the user agent stops parsing the document. Meaning, the DOM tree is ready.
- The user agent fires the DOMContentLoaded (DCL) event once any scripts marked with “defer have been executed, and there are no stylesheets that are blocking scripts. Meaning, the CSSOM is ready.
If no synchronous JavaScript is thrown into the mix, then the DOM and CSSOM construction can proceed in parallel. Things get more interesting once we introduce JavaScript into the picture.
If you add a script and tag it with “defer”, then you unblock the construction of the DOM: the document interactive state does not have to wait for execution of JavaScript. However, note that this same script will be executed before DCL is fired. Further, recall that JavaScript may query CSSOM, which means that the DCL event may be held until the CSSOM is ready, at which point the script will be executed. In short: we’ve unblocked the “document interactive” state, but we’re still potentially blocking DCL.
If you add a script and tag it with “async”, then you inherit similar behavior as above, but with one distinction: DCL does not have to wait for execution of async scripts!
The first important takeaway here is that by default, JavaScript will block DOM construction, which may block on CSSOM. Sync scripts are bad, but you already knew that. Marking scripts with “defer” and “async” makes an implicit promise to the document parser that you will not use doc.write, which in turn allows it to unblock DOM construction.
Second takeaways is: if at any point we must wait for JavaScript execution, then we will have to first wait for the CSSOM construction to finish. In other words, there is a hard dependency edge between JavaScript and CSS… Stylesheets at the top, scripts at the bottom? Now you know why.
Ok! This is all great in theory, but is this practical knowledge to help us optimize pages? Neither metric is a direct indicator of when the page will be painted, but monitoring either or both is a step in the right direction towards our ultimate goal of improving perceived performance.
Tracking the critical path of your page
If nothing else, monitoring “document interactive” will give you a good indicator of whether you are blocking DOM construction due to synchronous scripts. Sometimes, there is no way around this behavior, but this should be a known fact and a tradeoff, not an implicit “that’s how it works”.
The DCL event is also a critical milestone. Many popular libraries, such as JQuery, will begin executing their code once it fires. In other words, this is likely the first point at which your client code can begin interacting with the page, as well as provide meaningful feedback to the user. If you do your job right, then through the magic of progressive enhancement, you can get the skeleton of the page up, such that the user can begin interacting with the page while the browser continues to load the remaining assets. The IE team has an excellent example illustrating the difference between DCL and the window.onload events.
When does your DOMContentLoaded fire?
What you can measure, you can optimize. Even better, Navigation Timing spec already captures all the events we need: domInteractive, domContentLoadedEvent{Start,End}, and loadEvent{Start,End}. If you are already tracking the onload event already, then you might want to add the two events we’ve have covered here as well!
On that note, if you are using Google Analytics, then Christmas came early this year. The team recently added a new “DOM Timings” section. Guess which values it tracks? Yep.
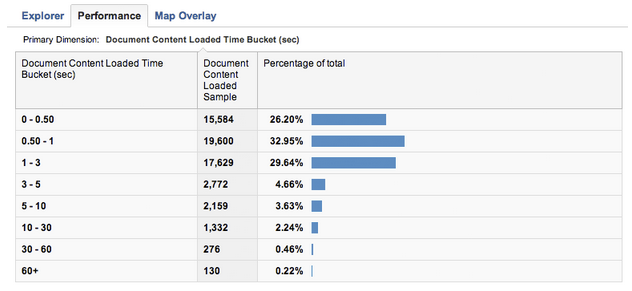
Login into your GA account and head to “Content > Site Speed“. Once there, head to the “Performance” tab to see the timing histograms for all of your pages, or drill into the stats for a particular page. From there, you can track your document interactive, DCL, and onload events.
Just for fun, here is a side by side comparison of the DCL vs. onload histograms for my site:
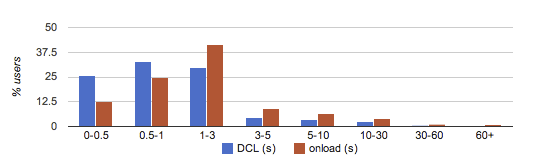
The median time to DCL is under 1s, whereas the median for onload is ~1.5s. The relatively high DCL timing immediately tells me that there is likely a script that is blocking the construction of the DOM – something I should revisit. Having said that, the fact that there is a ~0.5s delta between DCL and onload tells me that I’m not forcing users to wait for all the assets to download before they can see some of the content.
When do your document interactive and DCL events fire?