

Patrick Meenan (@patmeenan) created WebPagetest while working at AOL and now works at Google with the team that is working to make the web faster.
Synthetic performance testing for a website is when you use a computer running in a lab somewhere to run a browser and measure the performance of your site (usually one page at a time). It can come in many forms from a developer at their desk to a service like WebPagetest or one of several commercial offerings. Presumably you are doing the testing in order to analyze the performance that your users see while browsing your site, either as part of monitoring your site on a regular basis or in spot testing looking for issues or opportunities for improvement.
One of the big issues with synthetic testing is that you are measuring exactly one configuration and it may or may not be representative of your users visiting your site. In the case of a developer at their desk testing the site that is served from a server just down the hall or a service that is doing testing from a data center on a very fast connection the results will not be remotely representative of what your users will be seeing. Generally you need to do the testing from locations where your users are visiting from, using the browsers they are using and with similar connectivity to what they have (you probably want to skip the step of installing all of the spyware and viruses they also likely have).
Historically you have been able to use your analytics to tell you what browsers your users are using and where they are browsing from but the connectivity was largely a guess. With browsers now largely supporting Navigation Timing and lots of services being available to report on the data you have the information you need to be able to complete a largely accurate profile of your user’s experience and replicate that in your testing. For this example I will be looking at testing webpagetest.org and using the information from it’s Google Analytics reporting to build a user model for my testing.
Step 1 – Geography
This is pretty much analytics 101 and reporting on the geographies where your user base visits from is something that all analytics products do well. You have to be a bit careful to not dive in to looking at individual countries first though otherwise you might miss regions that are actually more popular. In the case of WebPagetest I looked at the sub-continent regions where the traffic comes from:
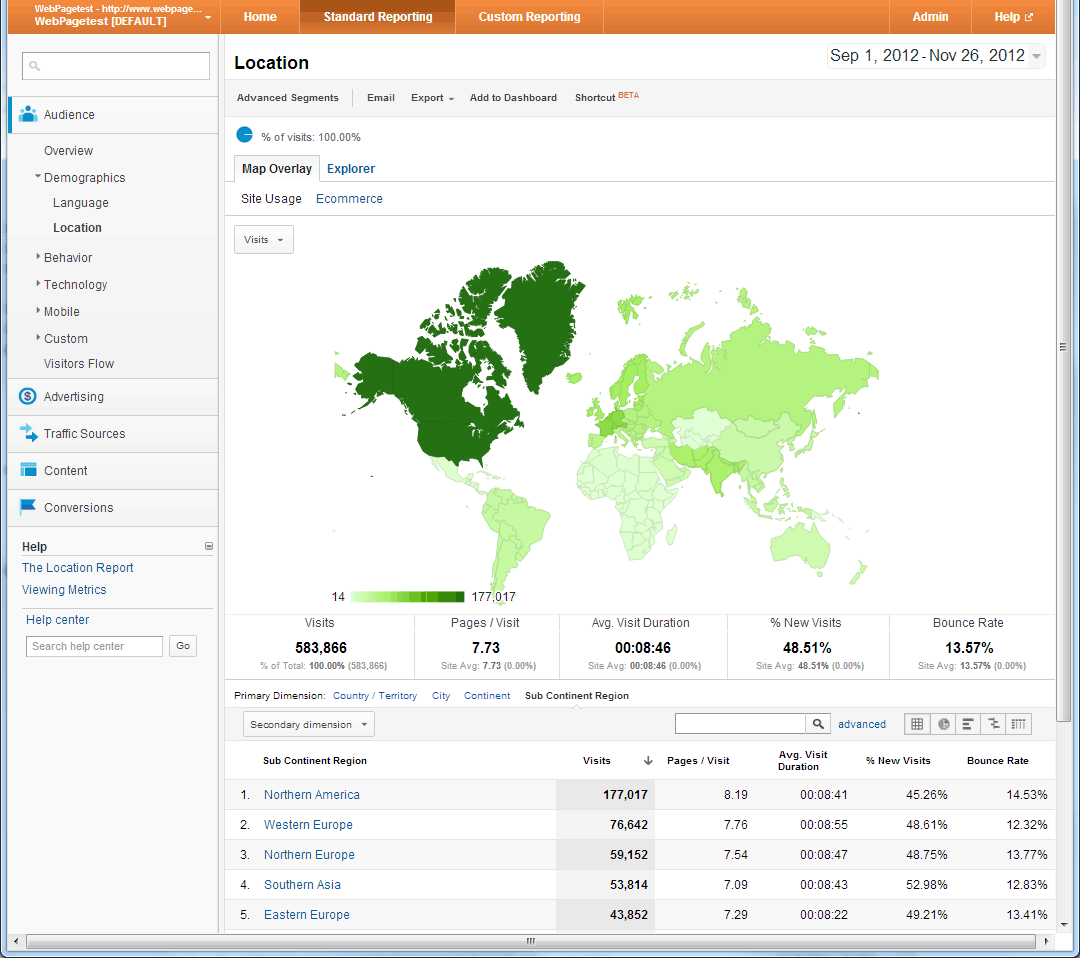
North America drives most of the traffic, followed by Europe and then Southern Asia. If I looked at the country report instead then India is actually the second largest source of traffic because the European traffic is split across lots of countries but they are all geographically close together so it makes more sense to look at them as a block. Once you have a geographic region you can also look within it to identify specific areas where you want to test from but for our purposes “US” and “Europe” will work well enough.
Step 2 – Browser
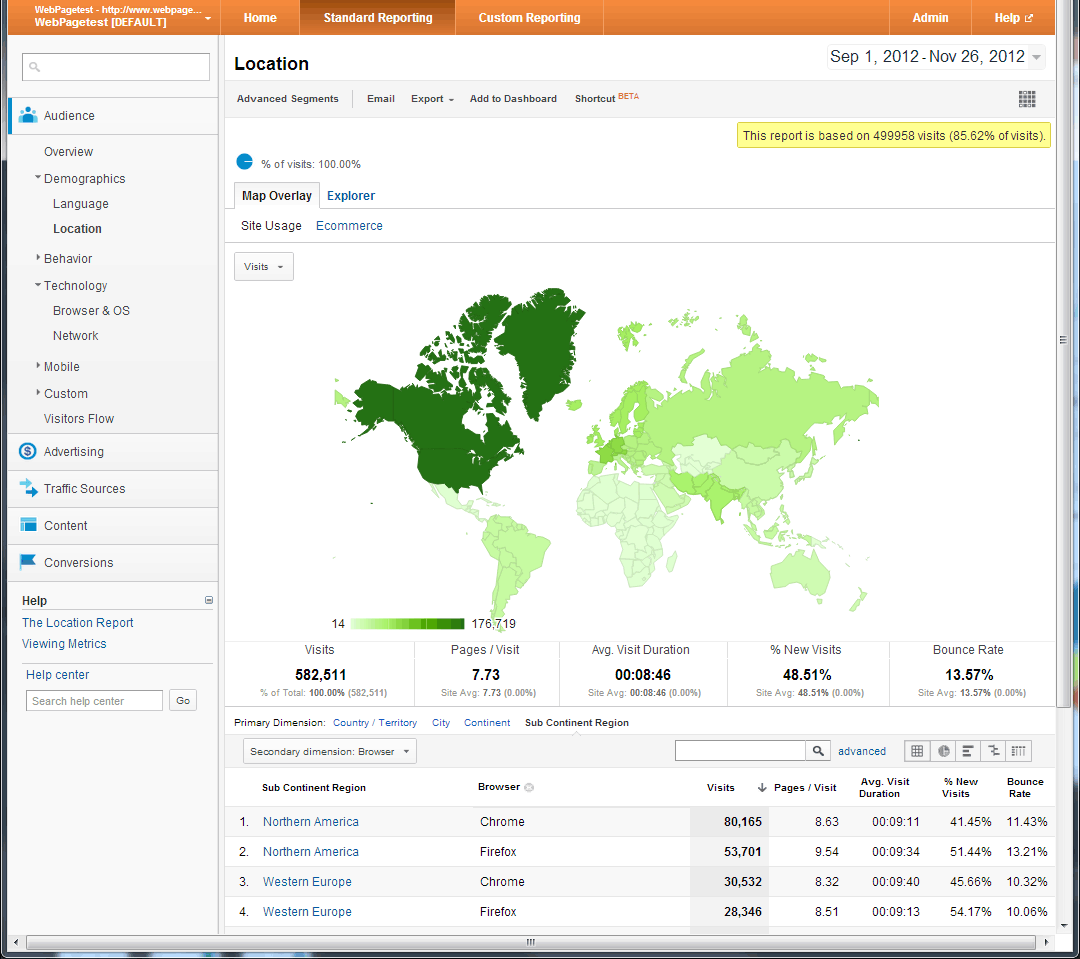
Once you have the geographies identified that you want to look at then you want to look at the browser usage for your site in each of those geographies. Do not base your testing on the overall browser distribution or sources of market share from other sites – you want to test using the browsers that YOUR users use in each specific region (and browser preferences are usually quite regional which is why it is important to look at the region you are testing specifically).
In the case of WebPagetest, we have a very technical audience and Chrome and Firefox completely dominate the browser usage (with Chrome having a pretty large lead in the US and pulling slightly ahead in Europe and a global IE usage of only 9%):
Step 3 – RUM Connectivity
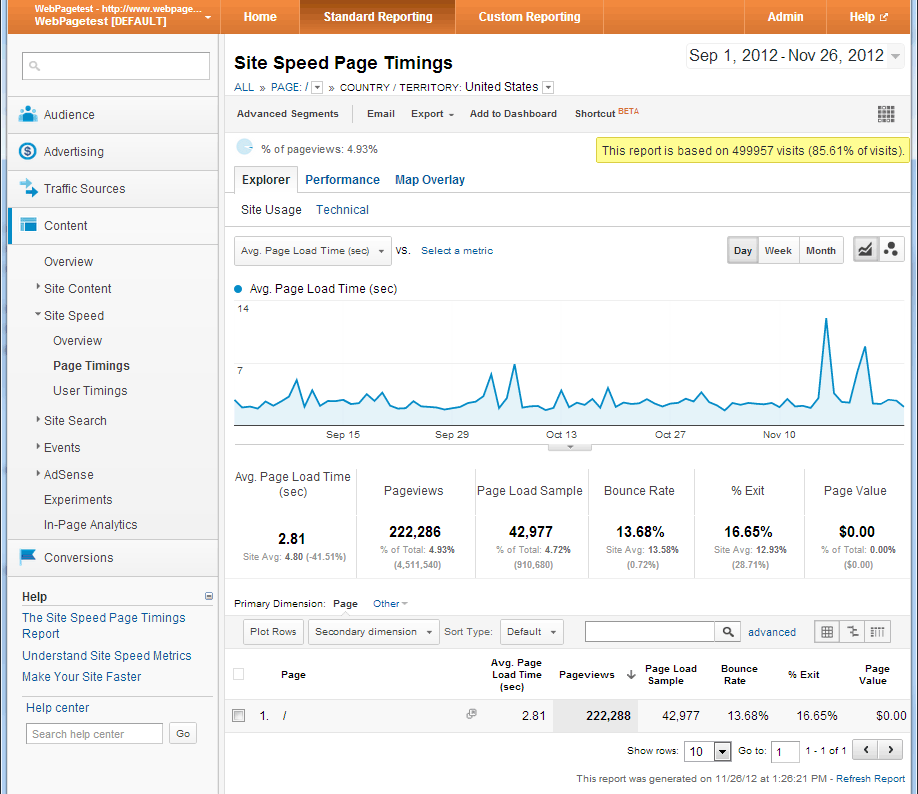
Now that we know where we are going to test from and which browsers to use we get to the really interesting part. We need to use the performance data available in analytics to guide our testing. The main thing we want to look at is the overall page load times but when building a profile you want to say as far away from averages and aggregate representations as possible. In Google Analytics the site performance data is reported under Content->Site Speed->Page Timings (selected in the left navigation).
The first thing you want to do is pick a single page to use for baselining the connectivity. It doesn’t have to be the page you ultimately want to test, you are just picking a single page to use for figuring out the kind of connectivity your user base has. The home page works well if it has reasonably consistent performance and enough traffic. Click on the link for the page you want to measure and the results will be filtered to display just that page (the filtering is built up and is displayed right under the title at the top of the page).
After you have the page identified and the data filtered to display just that page you want to restrict it to the region you are interested in looking at (the US in this case). You can do that by going to the “Map Overlay” tab and clicking on the region you are interested in. If you look at the top of the page where the filtering is displayed you should see both the page you are measuring as well as the region so now we are looking at the data for just the main page in the US:
As a final step before looking at the performance data you want to try to limit the data as much as possible to first time visitors. In Google Analytics you can sort of do this by opening the “Advanced Segments” menu and selecting “New Visitors”. That doesn’t guarantee that all of the data is from first view page loads but it helps get you closer. You can also set up a custom advanced segment that will limit the data to just Chrome users.
Finally, when looking at the data, you want to click on the “Performance” tab which will give you a histogram view of several different metrics. Expand any buckets where you want more granularity:
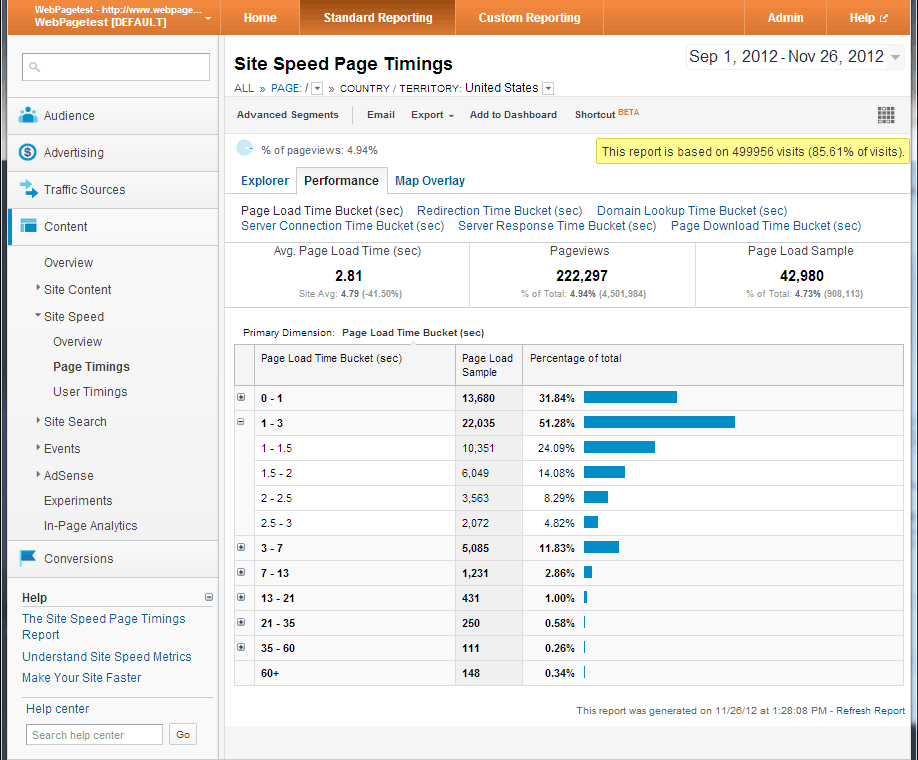
Start out by looking at the distribution for the page load times. In this case we see that ~55% of the page loads are under 1.5 seconds and 70% are under 2 seconds which gives us a good target to shoot for in our synthetic testing. You can also look at the Domain Lookup time and Server Connection times to help narrow down the latency measurements but I’ve found that the buckets in Google Analytics are a bit too coarse to provide specific targets. If you are collecting your own performance data though that could give you more information for building an accurate profile of your user’s connectivity.
Step 4 – Tune the Synthetic Tests
Now that we know what our end user experience looks like (for the main page for users in the US) we want to try to match that performance as closely as possible in our synthetic testing. As a starting point I ran several tests of the main page from WebPagetest itself using the different pre-configured connectivity types (DSL, Cable and Native) and Chrome as a browser from Dulles, VA. Each test was configured for 9 runs so that we could collect enough data to be reasonably confident with the results which were:
- DSL: 4.3 seconds
- Cable: 1.3 seconds
- Native: 0.9 seconds
With our target being somewhere between 1.5 and 2 seconds we need to do our testing with something that is close to the Cable configuration but just a bit slower. Tweaking the latency of the cable profile a bit so that we have a 5Mbps down, 2Mbps up and 40ms of last-mile latency gives us:
- Custom (5/2/40ms): 1.7 seconds
Voila, right in the sweet spot of our end-user performance. We can now use the custom profile to test any of the pages on the site from the US and feel confident that we are doing testing that is reasonably representative of our end-user experience. We can also compare the tests from the Cable and DSL connections to identify likely causes for slower performance in the tail and identify resources that can be optimized (in the case of WebPagetest it is the huge png image sprite of the partner logos).
Step 5 – GOTO Step 3
You need to tune the connectivity for each of the different regions you test from to make sure it is representative of the kind of connectivity your users have in that region. Luckily you only have to do this once for each region and just for a single baseline page.