

The rise of complex web applications and the widespread adoption of JavaScript-based server stack mean that, in some cases, the performance of some JavaScript code may affect the overall application performance. In this situation, it is imperative to analyze the performance carefully in order to come up with the right optimization strategy.
There is always the temptation to craft a microbenchmark, especially since it is easy to compare numbers which represent the execution speed of two (or more) different variants of the code. This choice is hardly without danger, a misstep in writing the benchmark may result in the falsified performance numbers. The question that we need to ask ourselves is simple, is it really fair to reduce the performance problem to a comparison of a set of numbers? In other words, are we always seeing the big picture or are we trapped into optimizing to the local extreme only?
It turns out that using the stopwatch measure to analyze any JavaScript performance is just one of many other possible techniques. Two other approaches, sampling and tracing will be described briefly here. For this purpose, let us assume a hypothetical situation: your son has some problem with math at school and his teacher asks you to look into it.
Sampling is the act of figuring out what is happening at the sampling time, carried out at regular intervals of time. In our school analogy, if your son is given the task to solve a particular complicated math problem, sampling means checking what he is doing every few minutes. After a couple of times you can start to have an idea why he has some difficulties. Perhaps he got distracted and wandered into the wrong path, or he simply did not focus enough on the actual problem.
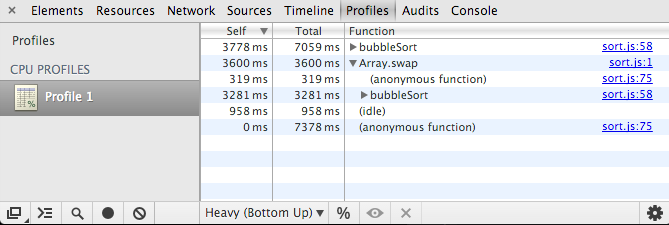
The same applies to JavaScript performance problem. Fortunately, most popular JavaScript engines support running a sampling profiler. In many cases, this is available straight from the browser’s developer tools. The visualization of the result of the profiler allows us to see the time spent on every function. Note that due to the observer effect, there can be a small difference between running the application with and without activating the sampling profiler. In realiy, this difference should be minimal and it should not impact your first educated guess as to where the bottleneck lies.
Tracing is the step-by-step following the execution for a given task. For a difficult math problem, it is helpful to look at how that problem is understood, broken down, and resolved. Examining every single step can reveal which areas your son has difficulties with. In addition, you would provide him with hints and instructions on how to take shortcuts to speed up certain steps.
Note that during the tracing analysis, do not think too much about the timing. Because execution tracking implies additional overhead, the time scale is not real-time anymore. The most important aspect of tracing is to see the traces of execution and not the time stamp of each execution step.
For web applications written in JavaScript, tracing can be implemented via code instrumentation. You can inject special logging statement for functions which you want to trace. In some cases, it is better to do it automatically via a tool which parse the code and insert the right logging. If it is done correctly, it can be useful for many things, among others to review the execution log as the application starts up. In addition, the numbers of function calls are valuable to determine the run-time complexity. This permits us to avoid being too narrowly focused on “how fast it is” (absolute elapsed time in the stopwatch measurement), in many cases the answer to “how scalable it is” (as it copes with larger data) is contributing more to the performance.
Generally speaking, tracing is a form of dynamic code analysis. Usually, the most common form of such analysis is code coverage. A typical use of code coverage analysis is to ensure that the unit tests exercise the code well. However, in the context of tracing, code coverage report contains some information that shows the nature of the execution. For example, if a certain code path is executed more than the rest, then it is an opportunity for a profile-guided optimization, perhaps by shuffling the code to prioritize the code path. This trick is quite familiar ever since we encountered math in high-school. Remember how we to take a shortcut to invert 2×2 matrices, as opposed to run the full-blown Gauss-Jordan elimination?
A very important aspect to tweak your application code to fit a certain profile is to have a representative data set. For example, the sorting function in an address book application needs to be benchmarked against a set of data which resembles a real-world contact list. An array of duplicated “John Doe” and “Jane Doe” entries will not serve as the right data set. Similarly, parser for comma-separated values (CSV) data usually needs to take into account that commas will appear quite frequently. Hence, the data to feed into the parser benchmark can not be simply the garbled characters from /dev/random.
It is cliché, but it is important to emphasize the danger of premature optimization. If portions of the performance bottleneck of your web application lie in some piece of JavaScript code, try to slice and dice it carefully. Verify that the algorithm used in the implementation is the most optimal solution for the problem. Run a few sampling sessions and analyze which parts of the code occupies the CPU most of the time. Prepare a representatives set of data for the benchmark to prevent future similar performance regression.
Happy optimizing!