

Dean Hume (@DeanoHume) is a software developer and author based in London, U.K. He is passionate about web performance, and he regularly writes on his blog - deanhume.com. He is the recent author of Fast ASP.NET Websites, a book aimed at improving the performance of ASP.NET applications.
Year on year, the weight of our web pages is gradually increasing. As web developers, we all know the impact that heavier web pages can have on page load times; they increase the amount of time that our users need to wait, which results in a poor experience. This gradual growth in page size is becoming significant. In fact, between March 2011 and March 2012 there was a 25% increase in the weight of web pages, and between March 2012 to March 2013 there was a 24% increase in the average weight of pages on the web. According to the HTTP archive, the average web page weight came in at around 700KB in 2010, and now in 2013 we are currently sitting at around 1653KB. In the past few years, it has more than doubled!
The HTTP archive is a fantastic resource for gathering useful web performance data. The project crawls over 300,000 popular websites twice a month and records the number and types of resources in great detail. If you aren’t familiar with the HTTP archive, check out the stats section of the site; it is packed with interesting statistics and allows you to visualize this data over any given month. Thanks to Google’s BigQuery, all of the data in the HTTP archive is now free and available to query. This is great news because you can simply query around 400GB of data from the SQL console in a matter of seconds.

Digging in…
I decided to use Google’s BigQuery and the data from the HTTP Archive to dig a little deeper into the the weight of web pages. I wanted to find out if there were any trends in the months of the year where web pages grew significantly. I started by running a query against the average page weights going back since the beginning of the data (November 2010) up until the most recent data. The result was interesting, however there were no obvious trends.
I then began to include more data, such as the average CSS, JavaScript, image sizes and the average HTTP requests per page. In general, there has been a year on year increase in the CSS, JavaScript and number of HTTP requests, but nothing statistically significant enough to warrant a trend. However, when I started to look into the weight of images, an obvious trend did start to emerge. I started to notice a pattern that showed an increase in the weight of images during certain months of the year.
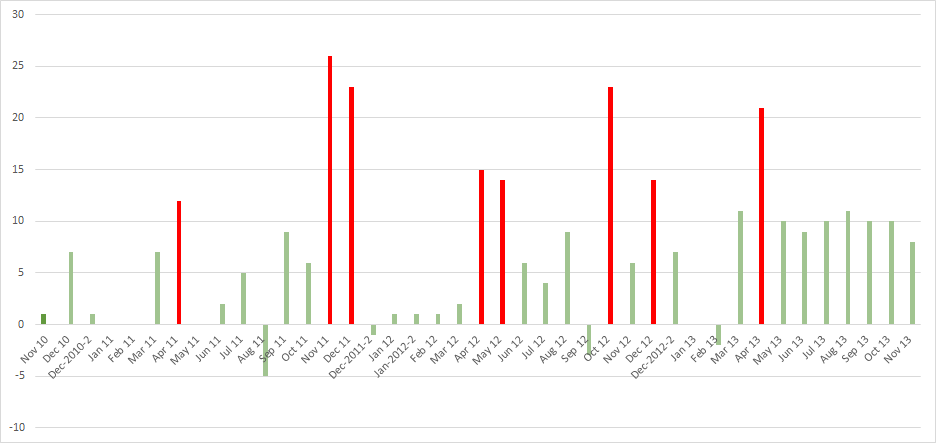
Using the HTTP Archive data, I produced the following data set in order to generate the chart above. You can see that there are peaks and troughs in the web page data, and what is interesting is that during the months of April and December there is a recurring increase in the overall image weights on our web pages that is above the expected growth rate.
As we know, annually the weight of web pages has increased, but I wanted to get an idea of how significant the data spikes during the months of April and December are. Were these just random spikes, or was the probability of them happening again more likely? As the data is positively skewed, I normalized the data by taking a running average of the total KB and looking at the difference in KB as a percentage of the total image KB. By calculating the mean and standard deviation of each month, it turns out that year on year, the months of April and December show a significant increase in the weight of images on our web pages. In fact, there is over an 80% spike outside of the normal month on month growth. What is interesting is that after this spike, the average monthly image KB doesn’t decline back to it’s prior size. It stays at this inflated level and continues normal growth.
Speed
In order to see if the increased data load had a negative effect on page load times, I ran a query across the data breaking down page load times by month. Although there was no obvious correlation between page load times and the increase in image size, this could be due to an ever changing testing environment and the phenomena of wildly varying load times on a daily basis.
Seasonal Trend
The only conclusion that I can draw from this data is that during the months of April and December, the weight of the images on our Web pages increases by approximately 15 – 25 KB. It is hard to prove an association between external factors and seasonal trends, but these spikes in web page weight most likely correlate to Christmas and Easter online spending. During the month of December, if you visit any popular eCommerce site, you will be bombarded with images and banners advertising promotions, discounts, and special offers. During these months, there is also a big seasonal change in fashion where there is a huge promotional push to clear the current season’s stock out of the warehouses in order to avoid writing any off. The data speaks for itself, but attributing this trend to web page growth can only be speculation.
Year over year, global connection speeds are growing faster and browsers are getting faster. However, as web developers, this growth in image weight is something we should keep in mind especially during the months when marketing materials can have a big impact on our websites.
Special thanks to Dr Alex Hill for her help with the calculation of these trends.