

Delivering web page content to users as quickly as possible is important. It is equally important to ensure that this downloaded content provides a smooth and responsive user experience. Page scrolls that are Janky, delays when typing in text boxes or choppy animations are just as bad as pages that take a long time to load. Users spend longer using the page than waiting for it to load and we should ensure that the page renders at 60 frames per second at all times.
Most modern web browsers have tools that could help identify the various things that could slow a web page down. However, rapid release cycles make it hard to do regular performance audits. Tools exist to automate network performance audits. It would be great to have a tool that automate the rendering perf audits too.
browser-perf
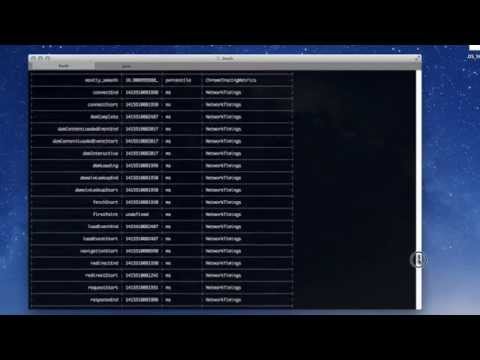
browser-perf is a NodeJS based tool that picks up performance data from browser developer tools and converts them to metrics like frame rates, expensive event handlers, paints, layouts, etc. It is based on Chromium’s performance test suite called telemetry. It runs tests on real browsers using the Selenium Web driver to mimic typical user interactions.
To test your website,
- Ensure that you have selenium installed and running.
- Install browser-perf from npm using
npm install -g browser-perf - Run
browser-perf http://example.com --verbose
These metrics can be collected not just during a page scroll, but also during actions like clicking buttons or typing content. The tool can record metrics from desktop (Firefox, IE, Chrome, Safari), mobile (Android and iOS) browsers and even Cordova or Hybrid apps (demo).
Case Study – The story of 5 commits
browser-perf can also be used as a Node module and the metrics collected can be plotted as a graph over time. A graph generated from the last four commits of this project illustrates how browser-perf can be used to identify commits that may slow down a page.
The five commits under consideration are
- First commit – Baseline, basic HTML with no styling.
- Added bootstrap styling, responsive design, resize/hide images.
- Added code that uses scroll handler and sets style
top. The scroll handler does a lot of work, making the scroll janky. - The scroll handler is improved, moving most logic to requestAnimationframe, and uses CSS transforms.
- Final Commit – Add external widgets, social buttons, etc.
Metrics like the average frame time and layout times show an increase when a bad scroll handler is added in the third commit. On the fourth commit when the code from the scroll handler is moved to a requestAnimationFrame, the frame rates and layouts get better.
Similarly, adding external widgets shows an increase in the time taken to parse the HTML and even the number of layers since each widget is an iFrame.
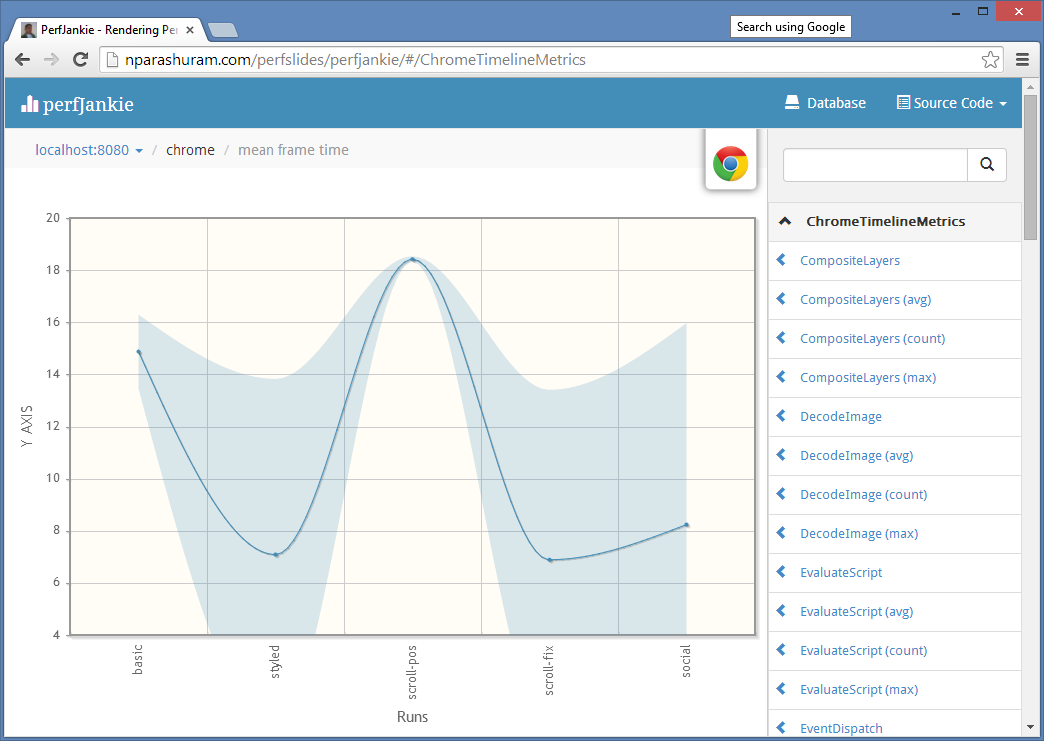
These graphs were generated using another node module called perfjankie that sits on top of browser-perf and saves the data and HTML for the graphs in a couchDB database. Perfjankie can also be used as a Grunt task.
A similar experiment of graphing the render performance of the bootstrap CSS library, from version 1 to the current version, shows some interesting trends.
Next steps
Integrating this module into your workflow should be simple. More documentation and instructions to setup and test for various environments are on the project’s wiki page. This link also lets you quickly test your web page by running browser-perf on Travis.
Monitoring network and rendering performance can ensure a great overall experience for your users.