

He wrote ‘The Pocket Guide to Web Performance' for Five Simple Steps, and is currently co-authoring ‘Using WebPagetest' for O'Reilly.
Whether it’s testing multiple pages to build an overall picture of site performance, testing a page across different browser, device and location combinations, or testing variations of the same page I end up generating lots of measurements and page load waterfalls.
Managing all this data isn’t easy. I’ve used a custom version of the HTTP Archive, other times a combination of WebPageTest’s Batch Tool and xmlstarlet to extract the results, and sometimes the bulk test feature that’s available with private instances of WebPagetest.
Managing test configurations and results with these tools can be awkward – the results end up spread across multiple files and completely disassociated from the test parameters that generated them – and so about a year ago, inspired by the spreadsheet Sergey Chernyshev uses during his “Meet for Speed” sessions I built a spreadsheet in Google Docs to drive WebPagetest via it’s API.
Tim Kadlec, Doug Sillars and a few others have been using the spreadsheet for a while and Tim in particular has been pestering me to write it up and release it properly.
To use the sheet you’ll either need an API key for the public WebPagetest instance, or your own private instance that’s accessible by Google Docs.
If you don’t already have an API key then getting them for low volume testing is likely to become much easier soon (but I can’t tell you about it just yet), and for higher volume testing Pat Meenan is going to cover the server AMI in another calendar post.
When it comes out of beta Khalid Lafi’s perflab.io will be another option for WebPagetest as a service but it uses a slightly different authentication mechanism and adding support for it is still on my to-do list!
Getting Started
To start using the spreadsheet make a copy of “WPT Bulk Tester v0.3” https://docs.google.com/spreadsheet/ccc?key=0AqYTxzF6y51WdEtSU3Q4Z29Sb1NPZ3M3M0VaUGhxSHc&usp=sharing
The spreadsheet has five tabs but the important ones are: Tests, Scenarios and Settings.
- Tests
- Scenarios
- Settings
Lists the URLs to be tested, the scenario (test parameters) to use of the test and results when the test has completed.
Scenarios are named collections of test parameters e.g test location and browser to use, along with any other WebPagetest parameters you want to apply.
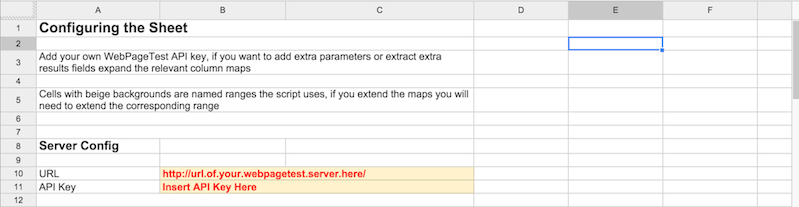
Unsurprising this contains all the configuration settings the spreadsheet needs – details of the WebPagetest server to be used (and if necessary, an API key) plus the look up tables for the API parameters and result values.
Running the First Test
A URL to test and some initial parameters are already in the default sheet but before running the first tests details of a WebPagetest server need to be added in the Settings tab.
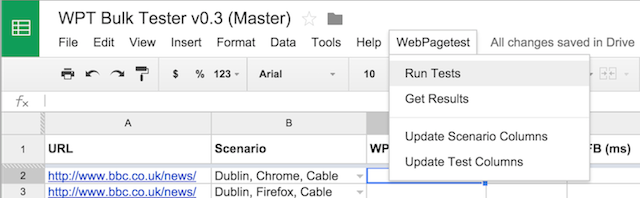
Once the server settings have been added the tests can be run via WebPagetest -> Run Tests from the menu.
The sheet sets a trigger to poll for the results and the first time it’s used Google Docs will prompt for permission.
Once permission has been granted choose WebPagetest -> Run Tests again and the tests will be submitted via the API.
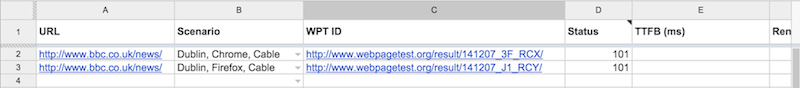
After the tests have been started you’ll see the link to the test, and the current response code from the API request in columns C and D of the Tests tab.
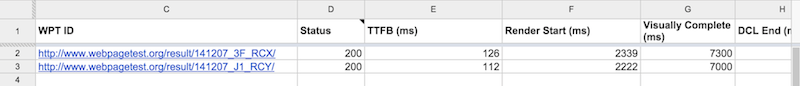
The sheet will then poll the WebPagetest instance until all the the tests complete, and populate the results into the relevant columns.
Note: As Google Docs is running the tests the spreadsheet doesn’t need to be kept open, so if you’re running many tests they can be started and the sheet closed.
Plotting Charts
In addition to keeping all the test parameters and results in one place, one of the great things about keeping all this data in a spreadsheet is it becomes really easy to plot charts.
In this example the BBC News homepage has been tested on 1 – 10 Mbps download speed and the Speed Index for each test plotted.

Running Your Own Tests
To test your own URLs, add the URL in column A of the Tests tab and then specify the scenario you want to test it against in column B.
Configuring Scenarios
If you want to add extra test scenarios or change the configuration of an existing one then the Scenarios tab is the place to do this.
The first column is the name of the scenario, and this is used in the drop down in the tests tab, column B is the test location to use, all the other parameters are specified in the Settings tab and can be customised.
Adding Extra Test Parameters
The default sheet only contains four test parameters – location, number of runs, whether to capture video and whether to repeat the test for the cached view – but more parameters can be added as needed.
Extra parameters can be added by editing the map of test parameters in the Settings tab:
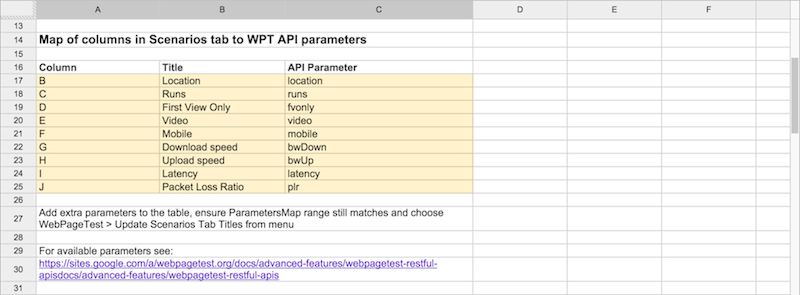
Add extra parameters at the bottom of the map. Each parameter needs a column name – this is the column in the Scenarios tab where the parameter is specified, a friendly name for the column heading, and the WebPagetest API parameter it maps onto.
In this example the parameters for emulating mobile in Chrome and shaping the network connection have been added.
Once the extra entries have been added, the named range ParametersMap needs to be updated to match the new dimensions of the map via Data -> Named and Protected Ranges
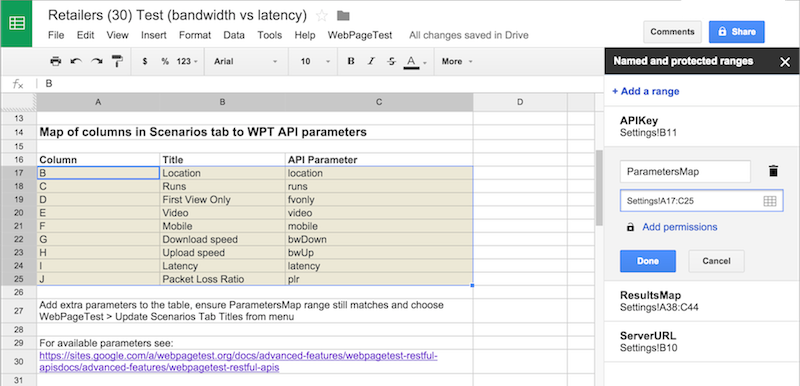
I also change the background colour of the range to make it easier to spot the parameters.
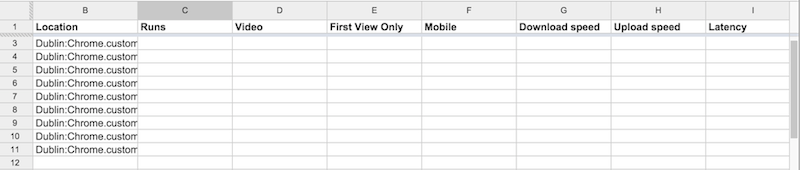
Once the named range has been updated choose WebPagetest -> Update Scenario Columns to update the column headers in the Scenarios tab.
Now values for our new test parameters can be added to our scenarios.
The list of parameters and their values covered in the WebPagetest docmentation https://sites.google.com/a/webpagetest.org/docs/advanced-features/webpagetest-restful-apis
Connectivity is specified as part of the WebPagetest location, so if you want to test with anything other than the default cable setting remember to add a connectivity setting to the location (it’s covered in the API documentation)
Adding Results Columns
The results values are mapped in a similar way to the test parameters with the named range being ResultsMap instead.
Again when new entries are added or existing ones removed, the ResultsMap range must be updated via Data -> Named and Protected Ranges and then WebPagetest -> Update Test Columns chosen to update the columns in the Tests tab.
The Column and Title entries within the map are pretty obvious. The Results Field is a path to the results field in JSON dot notation, so for example data.median.firstView.TTFB gives Time To First Byte for the uncached view from the median run.
Most properties are simple to access but to get the number of requests .length needs to be appended, for example: data.median.firstView.requests.length.
To understand what fields are available, run a test and add ?f=json onto the end of the test URL, for example:
http://www.webpagetest.org/result/141206_JF_R9D/?f=json
Wrap Up
The sheet’s been in use for almost a year now, Tim Kadlec uses it while working out performance budgets, I’ve used to repeat Mike Belshe’s latency vs bandwidth tests across a whole bunch of high profile UK sites and we’ve discovered a few quirks along the way.
Originally the sheet polled for results every minute but when testing large numbers of URLs it’s easy to exceed Google Docs URL Fetch quota, so now the polling interval is determined by how many URLs are being tested.
Occasionally the sheet will get a response it doesn’t understand (this seems to mostly happen when the test fails in WebPagetest) and this needs to be handled better.
I tend to find the sheet best for testing URLs against a few scenarios as the sheet starts to get a bit unwieldy as the combinations of URLs and test scenarios increases.
If you come across any issues, or have suggestions for improvement feel free to raise an issue or pull request on Github
I’ll also maintain a link to the latest version of the spreadsheet in the repository’s readme.
Enjoy!