

Once upon a time, Little Riding Hood, LRH to its friends, was tasked with making its way to an elderly request client across the topologically challenging paths of the forest. LRH put on its favorite blue wrapper and embarked on its journey. Its travels were swift & no dreaded Wolf Of Abandonment followed its tracks. It arrived safely at its designated request client. All was well.
One day, however, LRH put on a red wrapper before beginning its route to the request client. The red wrapper slowed LRH’s transit through the forest down significantly. A Wolf Of Abandonment was able to follow LRH along its path and devoured LRH’s request client.
Requiem for a Red Coat
To understand what caused LRH’s choice of color to slow it down, let’s take a look at this example:


As you can see, the red variant of the image is noticeably larger than its blue counterpart. Since both are primary colors, this is an unexpected & undesirable behavior. This example is one of the many small oddities of JPEG encoding and shows just how unexpectedly difficult JPEG compression can be when aiming for high performance images.
The Lay Of The Land
 Despite its unexpected oddities, JPEG is the predominant image format on the web.
It is ideally suited to show full color photographs, to which the human vision apparatus reacts to kindly with emotional responses. This and the fact that JPEG was available when the need for web images arose are major reasons for JPEG’s predominance.
Today, there are modern alternatives to the JPEG format: Google’s WebP and Microsoft’s JPEG-XR are among the better known. However, browser support and licensing issues have hindered their adoption. Recent studies by Mozilla also suggest that for web images, JPEG may be as well suited as any of its younger contenders.
 To create high performance, user-friendly websites, we need proper image compression – as Tammy Everts has shown in her excellent image optimization checklist. Images have a high correlation to page load times and many people wait for images to load before they interact with a website. However, images are binary blobs and generally do not benefit from compression techniques for plaintext assets – making image compression a craft of its own.
A Spot Of Bother
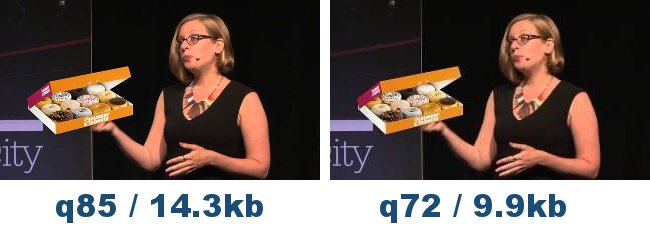
A well known spot of bother with JPEGs are its compression artifacts. They occur when compressing JPEGs to reduce byte size. While poorly compressed images slow websites down, visible compression artifacts in highly compressed images harm user experience and brand perception. Finding a balance between these two poles has been difficult.
Several “save for web” options of popular image editing tools have decided to set a default JPEG quality of 85 to offer an acceptable balance between byte size and visual quality. Google has opted for a setting of 75 for thumbnails shown on images.google.com to further reduce byte size at the cost of visual quality. We can recognize these trends when looking at JPEG quality distribution of a random JPEG sample of significant size:

We can clearly see the adoption of these quality trends across JPEGs on the web. People looking for a decent JPEG quality setting for their CMS image handling module or image optimization workflow have found encouragement to use the 85 or 75 quality setting.
This is problematic because the JPEG quality setting is not standardized in the JPEG ISO/IEC specification. All JPEG encoders are doing things differently under the hood when performing compression: different optimizations for Huffman tables, Trellis tables, chrominance & luminance and more.
“Applying a single JPEG quality setting from an unknown encoder as a best practice is a web performance anti-pattern”
Remembering above’s lesson of LRH’s poorly compressible red wrapper gives the aspect of not enforcing a single JPEG quality setting even more importance: not only does the JPEG quality setting cause different results in between encoders, but the contents of an image play an important role in how well it compresses. Images containing certain color variations will compress better than others. And high contrast object edges inside images are more likely to cause compression artifacts than smooth gradients.
Where Do We Go From Here
Knowing that image contents and encoder variants have a great influence on compression efficiency will help you achieve better results when adjusting JPEG quality settings manually. Yet in the context of a CMS with multiple users or when showing user generated content, manual image compression is impractical. We need to automate this process.
When deciding whether a JPEG quality setting yields acceptable compression results, we can make a visual comparison of the input and the output image. If the compression was too aggressive, visible artifacts may occur in the output image. We can make use of these visible changes and measure them to automate the process of optimized JPEG compression.
Measuring changes within an image visible to a human observer is a science of its own. The field of computer vision is constantly growing and scientists are writing papers on algorithms reflecting human visual perception. For our use case, the SSIM score, implemented by Kornel Lesiński in DSSIM, will suffice. It expresses the visual dissimilarity of one image to another in a decimal range from zero to one, e.g. “0.012345” meaning 1.2345% of measurable visual difference.

To make good use of DSSIM, we need to answer one more question: what is an acceptable visual difference in percentages? The research by Tammy Everts and Kent Alstad with NeuroStrata indicates that a DSSIM score of 0.015000 / ~1.5% is acceptable to the human observer.
Open Source Or It Didn’t Happen
Now that we know an acceptable visual difference level, we can automatically adjust JPEG quality levels during compression to aim for this sweet spot of 1.5%. Using a simple binary search approach, we can begin compression with a sensible default quality setting, measure the resulting visual difference of the output image with DSSIM and tune the quality level up or down accordingly. Once we detect a JPEG quality level for a given input image which results in a visual difference of ~1.5%, we accept this quality level as optimal and write the output image to disk – all prior runs are done in memory to reduce disk I/O.
I have created a simple tool to automate this process: cjpeg-dssim. It currently supports mozjpeg and jpegoptim, but other encoders can be easily added. A more complex alternative to cjpeg-dssim is imgmin by Ryan Flynn.
Take It Away, Ern
It can be a bumpy ride to find a suitable JPEG quality setting. To create a great user experience, we need to compress images optimally. Dynamically adjusting JPEG quality settings based on image contents and thereby playing to the strengths of the JPEG format yields much better compression results. Automate this process using tools such as cjpeg-dssim or imgmin to improve page load times and conversion rates. Don’t feed the Wolf of Abandonment.