

Steve works at SpeedCurve on the interplay between performance and design. He previously served as Google's Head Performance Engineer, Chief Performance Yahoo!, and Chief Performance Officer at Fastly. Steve has pioneered much of the work in the world of web performance. He is the author of High Performance Web Sites and Even Faster Web Sites. He is the creator of many performance tools and services including YSlow, the HTTP Archive, Episodes, ControlJS, and Browserscope. Steve taught CS193H: High Performance Web Sites at Stanford and serves as co-chair of Velocity, the web performance and operations conference from O'Reilly.
A big change in the World of Performance for 2015 is the shift to metrics that do a better job of measuring the user experience. The performance industry grew up focusing on page load time, but teams with more advanced websites have started replacing PLT with metrics that have more to do with rendering and interactivity. The best examples of these new UX-focused metrics are Start Render and Speed Index.
Start Render and Speed Index
A fast start render time is important for a good user experience because once users request a new page, they’re left staring at the old page or, even worse, a blank screen. This is frustrating for users because nothing is happening and they don’t know if the site is down, if they should reload the page, or if they should simply wait longer. A fast start render time means the user doesn’t have to experience this frustration because she is reassured that the site is working and delivering upon her request.
Speed Index, a metric developed by Pat Meenan as part of WebPageTest, is the average time at which visible parts of the page are displayed. Whereas start render time captures when the rendering experience starts, Speed Index reflects how quickly the entire viewport renders. These metrics measure different things, but both focus on how quickly pages render which is critical for a good user experience.
Critical Resources
The main blockers to fast rendering are stylesheets and synchronous scripts. Stylesheets block all rendering in the page until they finish loading. Synchronous scripts (e.g., <script src="main.js">) block rendering for all following DOM elements. Therefore, synchronous scripts in the HEAD of the page block the entire page from rendering until they finish loading.
I call stylesheets and synchronous scripts “critical blocking resources” because of their big impact on rendering. A few months back I decided to start tracking this as a new performance metric as part of SpeedCurve and the HTTP Archive. Most performance services already have metrics for scripts and stylesheets, but a separate metric for critical resources is different in a few ways:
- It combines stylesheets and synchronous scripts into a single metric, making it easier to track their impact.
- It only counts synchronous scripts. Asynchronous scripts don’t block rendering so they’re not included. The HTTP Archive data for the world’s top 500K URLs shows that the median website has 10 synchronous scripts and 2 async scripts, so ignoring those async scripts gives a more accurate measurement of the impact on rendering. (I do this as a WebPageTest custom metric. The code is here.)
- Synchronous scripts loaded in iframes are not included because they don’t block rendering of the main page. (I’m still working on code to ignore stylesheets in iframes.)
Critical Metric
I’m confident this new “critical resources” metric will prove to be key for tracking a good user experience in terms of performance. Whether that’s true will be borne out as adoption grows and we gain more experience correlating this to other metrics that reflect a good user experience.
In the meantime, I added this metric to the HTTP Archive and measured the correlation to start render time, Speed Index, and page load time. Here are the results for the Dec 1 2015 crawl:
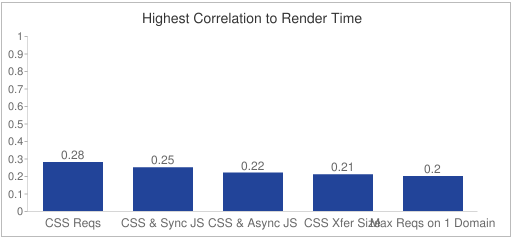
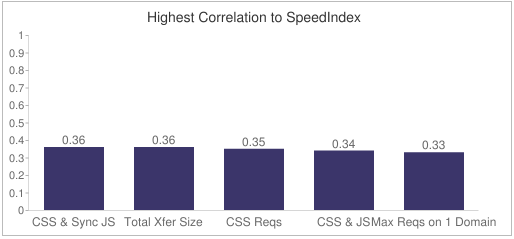

The critical resources metric described in this article is called “CSS & Sync JS” in the charts above. It has the highest correlation to Speed Index and the second highest correlation to start render time. This shows that “critical resources” is a good indicator of rendering performance. It doesn’t show up in the top five variables correlated to load time, which is fine. Most people agree that page load time is no longer a good metric because it doesn’t reflect the user experience.
We all want to create great, enjoyable user experiences. With the complexity of today’s web apps – preloading, lazy-loading, sync & async scripts, dynamic images, etc. – it’s important to have metrics that help us know when our user experience performance is slipping. Tracking critical resources provides an early indicator of how our code might affect the user experience, so we can keep our websites fast and our users happy.