

Pierre Lermant is an Enterprise Architect at Akamai Technologies, specialized in improving the performance, availability and operations of customer-facing web applications.
Summary
The middle-mile RTT, or the time it takes for a data packet to perform a round-trip between two servers located on the internet backbone, has a critical impact on website performance. Yet if you ask people how to compute it, chances are they’ll pause and admit there is no good formula to predict it, short of performing a “ping” between the 2 locations.
Below is a simple model based on empirical measurements to determine this RTT as a function of the distance between the client and the server.
RTT in the wild
RTT has an obvious lower bound, computed by the time it would take a ray of light in a vacuum to travel in a straight line between the end-points and back. However in real life situations, the RTT of an IP packet is much slower for the following reasons:
- Non-straight lines between the source and the destination – This is primarily the result of ISP business peering relationships, not always motivated by ensuring fastest IP packet delivery! It is common to see the internet public route, driven by BGP tables, be more than twice as long as the geometrical distance.
- Light speed in fiber optic is about 40 % slower than in vacuum
- Congestions and delays incurred in routers and other internet hops.
- Unreliable networks. Hardware failures, DDoS attacks, misconfigurations, cut cables or de-peering can all combine to increased latency or even plain failures in extreme cases.
As a result, and not surprisingly, there does not seem to be any authoritative information on the web that would help predict the RTT between 2 given locations, so I wanted to find out if an empirical model could fill this gap.
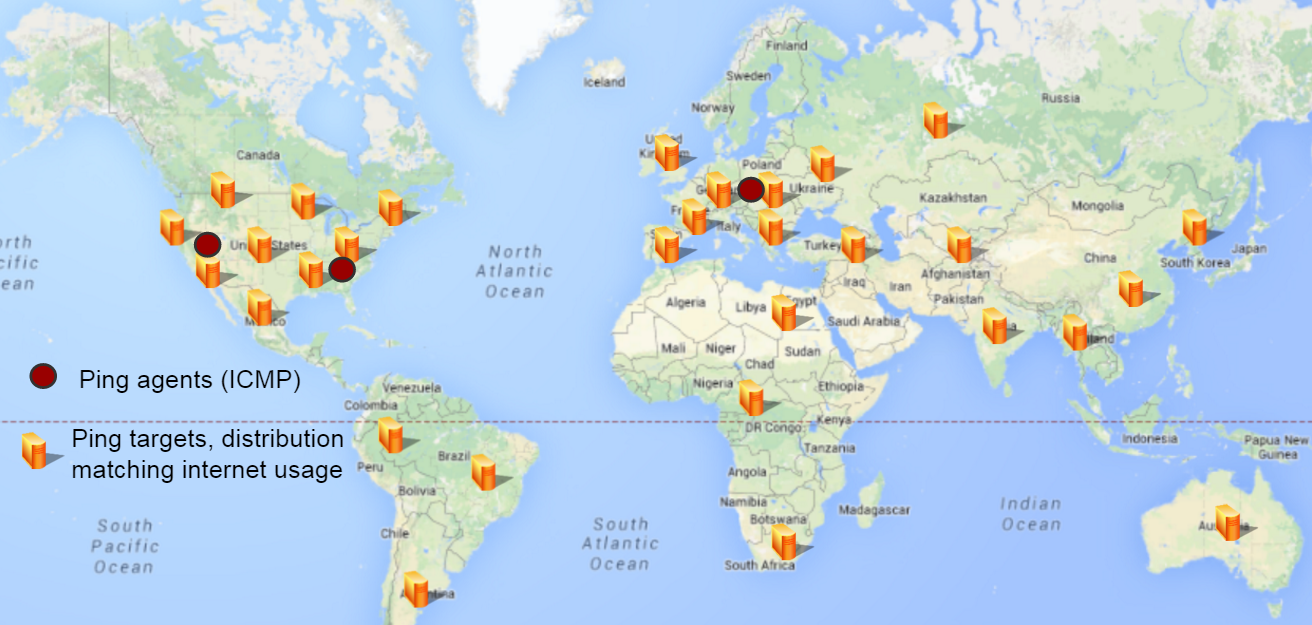
Empirical Setup
I leveraged the large footprint of the Akamai platform and conducted sets of ping point measurements (ICMP) spread across the world. Throughout the US and Europe, I tracked the middle-mile observed RTT over time, then plotted its ratio over theoretical RTT (vacuum, straight line), called here RTTR, against the geometric distance between the source and the destination.
Test Setup:
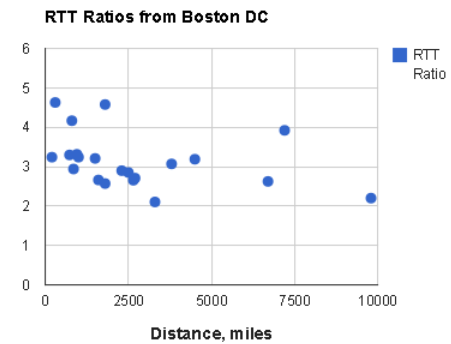
Sample scatter plot, from a Boston client to servers around the globe:
Main Findings
I found that, on average, and for distances greater than 500 miles:
- RTTR is geographically uniform and fairly independent from the distance source-target, at least throughout Americas and Europe
- It tends to hold the same value over time
- It has a median value of 2.9, with a vast majority of data points between 2 and 4
From these experimental results, we can therefore model (simple math based on speed of light):
Observed middle-mile RTT (ms) = RTTR * 0.0108 * Distance (miles), or based on results above:
Middle-Mile RTT (ms) ~ 3.1 % * Distance (miles)
In other words, given two far-apart locations connected to the backbone, the median RTT between them (in ms) will be about 3% of their distance (in miles).
e.g. San-Francisco is about 2600 miles from New-York so the median RTT is 75-80 ms (3 times 26). Easy to remember!

This empirical mnemotechnic ‘trick’ starts breaking down for shorter distances (say < 500 miles), however if the client and server are not far from each other, then the RTT is not drastically negatively impacting performance anyway …
Resource Download Time Prediction
If you’ve reached this point, you’ve probably come across my previous entry about the impact of TCP slow start on performance. By combining the 2 blogs, we can plot the median download times for various web asset sizes based on the distance between the client and the server, for various connections.
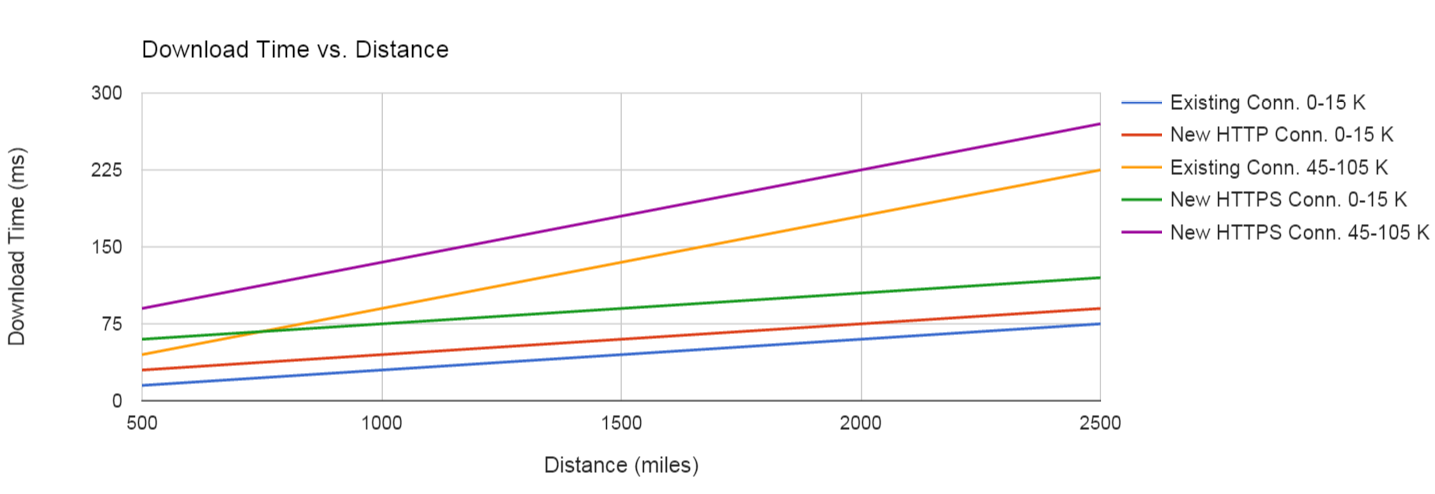
The graph above is for the middle-mile connectivity. For actual download times from the client, the first and last miles RTTs would have to be taken into account.