

Tim Vereecke (@TimVereecke) loves speeding up websites and likes to understand the technical and business aspects of WebPerf since 15+ years. He is a web performance architect at Akamai and also runs scalemates.com: the largest (and fastest) scale modeling website on the planet.
FRUSTRATIONindex – mind the gap
FRUSTRATIONindex, a new KPI which will change how we look at web performance in 2020.
This easy to consume index quantifies frustration loading web pages:
- It is a meaningful KPI for both business and IT
- It quickly identifies frustration hotspots
FRUSTRATIONindex looks at the gap between metrics instead of looking at them individually. The bigger the gap the bigger the chance a user gets frustrated.
I use the index on my own website, scalemates.com and track it both via RUM as well as synthetically via the WebPageTest API.
As I am really excited about the approach, I launched www.frustrationindex.com: a free tool to calculate the index from any public WebPageTest result URL.
![]()
This blogpost starts with the problems it solves followed by a full detail on the how and why.
Solving 3 problems
Despite the evolution in #WebPerf with plenty of new timers and tools, there is still no definitive answer to some basic questions:
- Which metric should you monitor and tune?
Do you pick Pageload, TTI, FCP, TTFB or any of the dozen other metrics?
Each has their own merit, but which one is the most important one requiring your attention? - Which metric resonates within the full organisation?
Keeping it simple and easy is key when explaining a complex subject like #WebPerf to the business.
Picking one which resonates well with the business is a bigger challenge - Clear performance gains but no business impact?
Your favorite tool clearly shows a positive impact on performance!
Unfortunately, the business questions your statement that #PerfMatters as they don’t see any impact.
Not having a simple answer to those will maintain our challenges to influence why #PerfMatters.
#WebPerf from a different angle!
We should not change how we measure and tune! We should look at the existing data from a different angle.
The root cause for our problems is the assumption that making a metric faster always results in a better experience.
We should stop following the mantra that faster is always better.
“The gap between metrics is a better KPI for user experienceâ€
FRUSTRATIONindex follows a different mantra. Rather than looking at metrics individually it looks at the gap between them. The bigger the gap the bigger the chance a user gets frustrated.
This is a fundamentally different compared to the past: FRUSTRATIONindex indicates how improving one metric could actually result in a larger gap, therefore impacting end user experience in a negative way.
It looks at 4 key milestones perceived by the end-user while loading a webpage:
- Title is visible (Time to First Byte)
- First content is visible (First Contentful Paint)
- Visually ready (SpeedIndex, TTVR in Boomerang, LCP in Chrome)
- Page looks ready (Largest value of Pageload and Time-to-Interactive)
Simple score indicating frustration
FRUSTRATIONindex is an easy to consume score indicating the level of frustration while loading a page.
The higher the value the higher the chance users are frustrated and therefore impacting the business.
The index ranges from 0 (best) to 100 (worst) and uses 4 color codes to indicate likelihood of frustration:

Identify frustration hot spots
FRUSTRATIONindex comes with a powerful visual indication of where frustration actually happens.
This helps prioritizing where to focus in your next performance tuning sprint.

Calculating the Index
The simplicity of the score allows it to be calculated both in synthetic tools as well as RUM tools.
$frustrationIndex = calculateFrustrationIndex();
function calculateFrustrationIndex() {
  /*
  *  $totalFrustrationPoints = A + B + C + D;
  *  A = frustration points between navigation start and TTFB
  *  B = frustration points between TTFB start and FCP
  *  C = frustration points between FCP start and Visually ready (SpeedIndex or soon LCP)
  *  D = frustration points between Visually ready start and largest value of (TTI and pageload)
  */
  $totalFrustrationPoints =
    calculateFrustrationPoints($ttfb, 0, 100) +
    calculateFrustrationPoints($fcp, $ttfb, 100) +
    calculateFrustrationPoints($visuallyReady, $fcp, 100) +
    calculateFrustrationPoints(max($tti, $onload), $visuallyReady, 250);

  // Index can't by higher than 100, 10000ms is the break point for guaranteed frustration.
  $frustrationIndex = min((sqrt($totalFrustrationPoints) / 10000) * 100, 100);

  return $frustrationIndex;
}

// Frustration only kicks in after a $threshold.
// After kicking in it grows exponentially.
// Default $threshold is 100ms, based on Jakob Nielsen
// https://www.nngroup.com/articles/response-times-3-important-limits/
function calculateFrustrationPoints($timer, $reference, $threshold = 100) {
  return pow(min($reference - $timer + $threshold, 0), 2);
}
Below are the thresholds for steps A, B, C and D marked in green. Only when the gap is larger than the threshold, frustration kicks in.

Extending the Index
The initial BETA version uses metrics available to typical WPT result pages. There are however other elements which can indicate user frustration, therefore Real User Monitoring (RUM) tools can extend the index with additional elements contributing to frustration. For example:
- Long tasks
- Rage clicks
- First Input Delay FID
- FPS
- Cumulative layout shift
RUM integration: scalemates.com already calculates FRUSTRATIONindex client side and sends it to mPulse/Boomerang as a custom dimension. This allows me to track it over time and correlate it with business metrics.
Detailed example
Suppose you have performance measurements for 3 versions of a page:
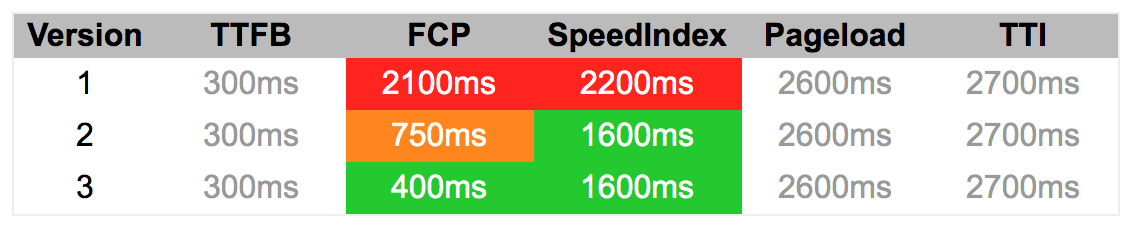
Traditionally looking at the individual metrics Version 1 is the slowest and Version 3 is clearly the winner: The 3 tests share the same TTFB, Pageload and TTI, so we would focus on FCP and SpeedIndex. Version 3 has the fastest values for both FCP and SpeedIndex and following the mantra that faster is better must therefore have the better user experience.
Now is it? FRUSTRATIONindex claims Version 2 as the winner
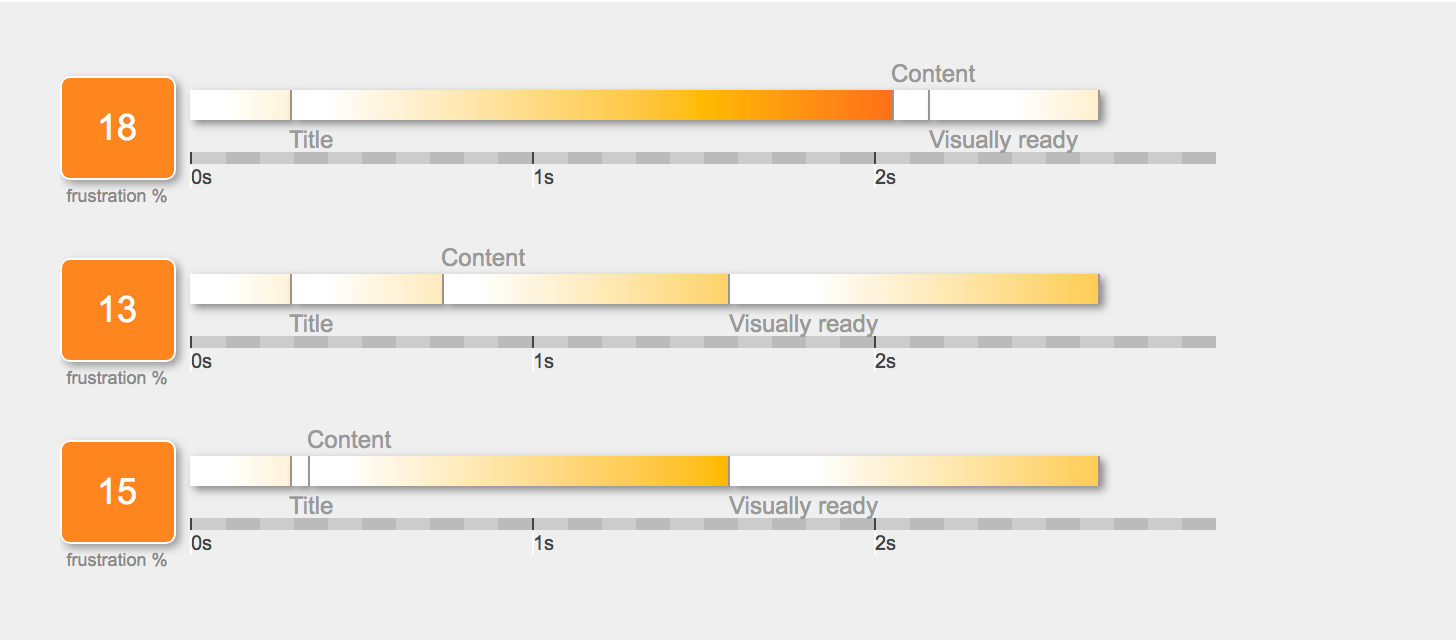
Reason? Although further improving the FCP in Version 3 the increased gap between FCP and SpeedIndex leads to a bit more frustration.
FRUSTRATIONindex is NOT a timer, it is a score taking into account the gap between key timers. The longer a transition takes the bigger the frustration level for the user.
Summary
FRUSTRATIONindex looks at the gap between metrics instead of looking at them individually. The bigger the gap the bigger the chance a user gets frustrated.
On www.frustrationindex.com you can start quantifying frustration loading your web pages.
This is an early beta. Feedback and suggestions welcome @TimVereecke!