

Ever since h2 (a.k.a. HTTP/2) was finalised in February 2015 there has been much written about the advantages of turning the protocol on. The first, and often biggest, hurdle for some is the move to a fully secure site using TLS (2 great examples here and here). In this post we will assume the hard work of that move has been completed and the relatively simple task of turning h2 on has also been done, either at your own server or via a CDN.
Like any performance optimisation, once implemented we should measure and tweak. In this post we cover some practical tips for measuring h2 performance improvements and also what to do with some common issues that arise when moving to h2.
Successfully Measure h2
Use RUM not synthetic
Ultimately RUM gives you information about your own users, which is what you care about most.
It is unlikely using synthetic testing you will be able to measure all the permutations for different bandwidth, latency and packet loss and each one plays it’s own part in the effectiveness of h2 performance. In general h2 will outperform HTTP/1.X on connections with high latency, connections with low bandwidth or high packet loss can even make HTTP/1.X faster.
Webpagetest remains the tool of choice for debugging issues, especially around h2. However, it has been found that the simulated connections can throw different results to actual tests on similar conditions. Use connection simulation carefully.
A/B test at the same time
Be sure to split h2 on and h2 off traffic into equal samples that can be measured at the same time. The alternative of testing at different times will no doubt lead to skewed results as the content will differ. Keeping your own content the same for any extended period of time is hard enough but guaranteeing 3rd party content will not change is next to impossible.
Pick a metric (and think about 3rd party content)
Pick a metric that closely correlates to how a user perceives performance of a page. For example, don’t use total load time if you are lazy loading 5MB of unseen images.
If your website has a lot of 3rd party content then pick a metric that corresponds as closely as possible to when the first party content is loaded. Better still; think about adding custom timings to the page using the User Timing API to mark when the h2 content starts and finishes.
Split results by browser
Browser implementations for h2 are still new and are changing all the time. Once data has been collected be sure to filter the results by browser type.
In an experiment I run 6 months ago, Firefox had gone from being the most efficient h2 browser to one of the worst.
Split results by Network types
Network conditions can vary the performance improvements of h2. Be sure to drill into RUM data to analyse the performance across different network types.
The graphs below shows a US retailers wired connections not showing too much benefit of turning on h2 on the left. The graph on the right shows the same period for cellular connections.
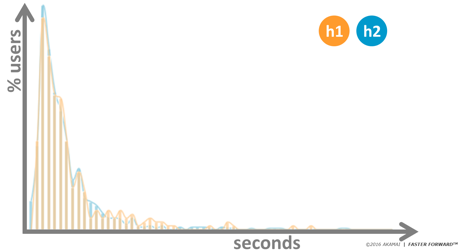
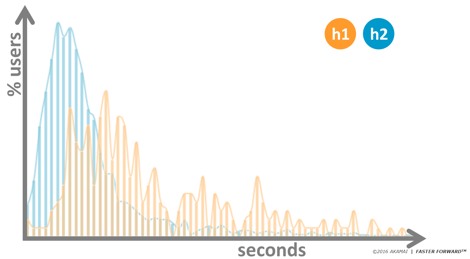
Analyse ALL results
Don’t use averages and means. Reviewing histograms like those shown above and looking at the number of users above and below certain thresholds can help compare what h2 is doing for the outlying users with fast experiences and those with slower experiences.
Rendering
One area that often suffers as a result of turning h2 on is the perceived performance or more importantly the time it takes to paint content to screen, known as rendering time. This is usually caused by bandwidth contention for some of the pages critical resources. An example from the Hacker News can be seen below.

Below are a few suggestions to help improve rendering in h2
Reuse the same connection
Best practice suggests putting all critical content for rendering on the same domain. If this is not possible, then try and make the two domains share a certificate and resolve to the same IP address. This will reduce new connections being made that will delay rendering.
Progressive JPGs
Progressive JPG’s can paint more with less, and with h2 that can be important if you have lots of images loading at the same time. The more images you have the lower available bandwidth they are assigned. This can result in the total time to load all the images being reduced, while the time to load each individual image increases. The screen below shows progressive JPGs complete when traditional ones are only 60% complete.

Lazy load none critical content
Lazy loading is not a new technique, but it can be used to good effect with h2 to delay loading of non-critical resources and ensure that the critical content gets as much access to the bandwidth that it needs. Essentially build your own prioritisation and hierarchy using JS.
Server Push
Pushing objects can give the biggest improvements to rendering times but with great power comes great responsibility. Don’t push the wrong content and don’t push too much. Also, right now browsers don’t do a great job of cancelling streams for already cached resources so think carefully about repeat visitors. http://canipush.com and http://shouldipush.com are 2 great resources for investigating your push opportunity.
Old optimisations and anti-patterns
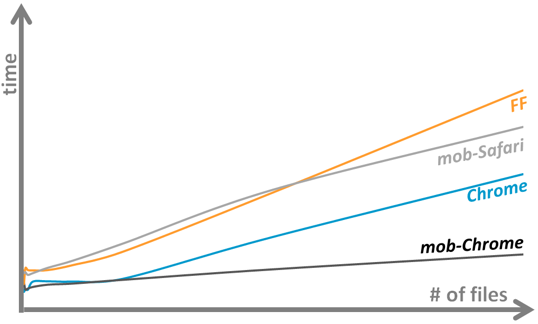
In various tests carried out on JS, CSS and images the overall conclusion is that we should continue to combine files with h2. A request for a separate file is not free and requesting too many files can move bottlenecks to the browser or the TCP layer. With all file types across all browsers tested, requesting fewer files was always faster than requesting more.
H2 did perform better than HTTP/1.X in most cases, so we can conclude h2 is more efficient at dealing with large numbers of files, however it is not faster. Below is a sample of the results from the JS test run in all the h2 supported browsers on WPT.
The Future
If you haven’t already turned on h2, then why not?
It is simple to turn on (if already serving a secure website). You never know, you may be one of the lucky ones that simply turning on could introduce performance benefits of up to 30% in page load times, but be sure to measure in a fair and effective way.
However, if you are not one of the lucky ones, don’t give up. There are still many things that can be done today to optimise the performance, just like for HTTP/1.X.
It is not just websites that can benefit from optimisation. Browsers, servers and CDN’s are continuing to evolve and optimise their implementations. There has also been a lot of industry focus on the use of TCP for h2, some believing it has become the next bottleneck. As such QUIC has been established as an alternative transport layer that should outperform TCP connections across a wider range of connection types.
With all of this work going on, a site delivered over h2 site may just start to improve naturally as we start to truly understand the protocol better and implement more and more optimisations across the full stack.