Peter Hedenskog (@soulislove) works in the performance team at the Wikimedia Foundation. In 2020 Peter and his teammates arrange a afternoon of web performance talks at FOSDEM 2020. Peter is also one of the creators of the Open Source sitespeed.io web performance tools.
Me and the rest of the performance team of Wikimedia share a dream: A JavaScript free version of Wikipedia for readers. But at the moment we ship a lot of JavaScript to every user. We ship it asynchronously but we ship a lot! Wikipedia loves JavaScript! We have a long history and a lot of legacy so changing that would mean a lot of effort for many teams.
And it is hard to change if you don’t have any metrics that shows how JavaScript impacts our users. That’s why we all are happy about the new First Input Delay metric that arrived in Chrome 77 and the CPU Long Tasks API (that arrived long time ago in Chrome 58). Both are browser APIs (only supported by Chrome at the moment) that helps you get information how JavaScript impacts the user.
We just started to use these APIs and I want to go through a couple of gotchas. Lets start with the oldest one, the Long Tasks API.
Long tasks
The Long Tasks API makes it possible for the browser to report if a task on the CPU main thread is taking up 50 ms or more. Long CPU tasks can make your page unresponsive so its a good metric to keep track of.
For our real user measurements we haven’t started using long tasks for two reasons:
- You need to enable collecting long tasks as early as possible when the page load so that you don’t miss anything. Preferable in the
headtag. But doing that is hard for us, because we normally don’t know that the page load will be sampled at that point. We can fix that but it means some work. The good news from the last WebPerfWG call is that it’s easy for Chrome to implement thebufferedflag and it will land in Chrome 81. That means it doesn’t matter when you enable the long task observer, you will get all the long tasks. - The other problem is attribution. We need to know what is causing our long tasks so we can act on them. But today its hard to understand what’s going on.
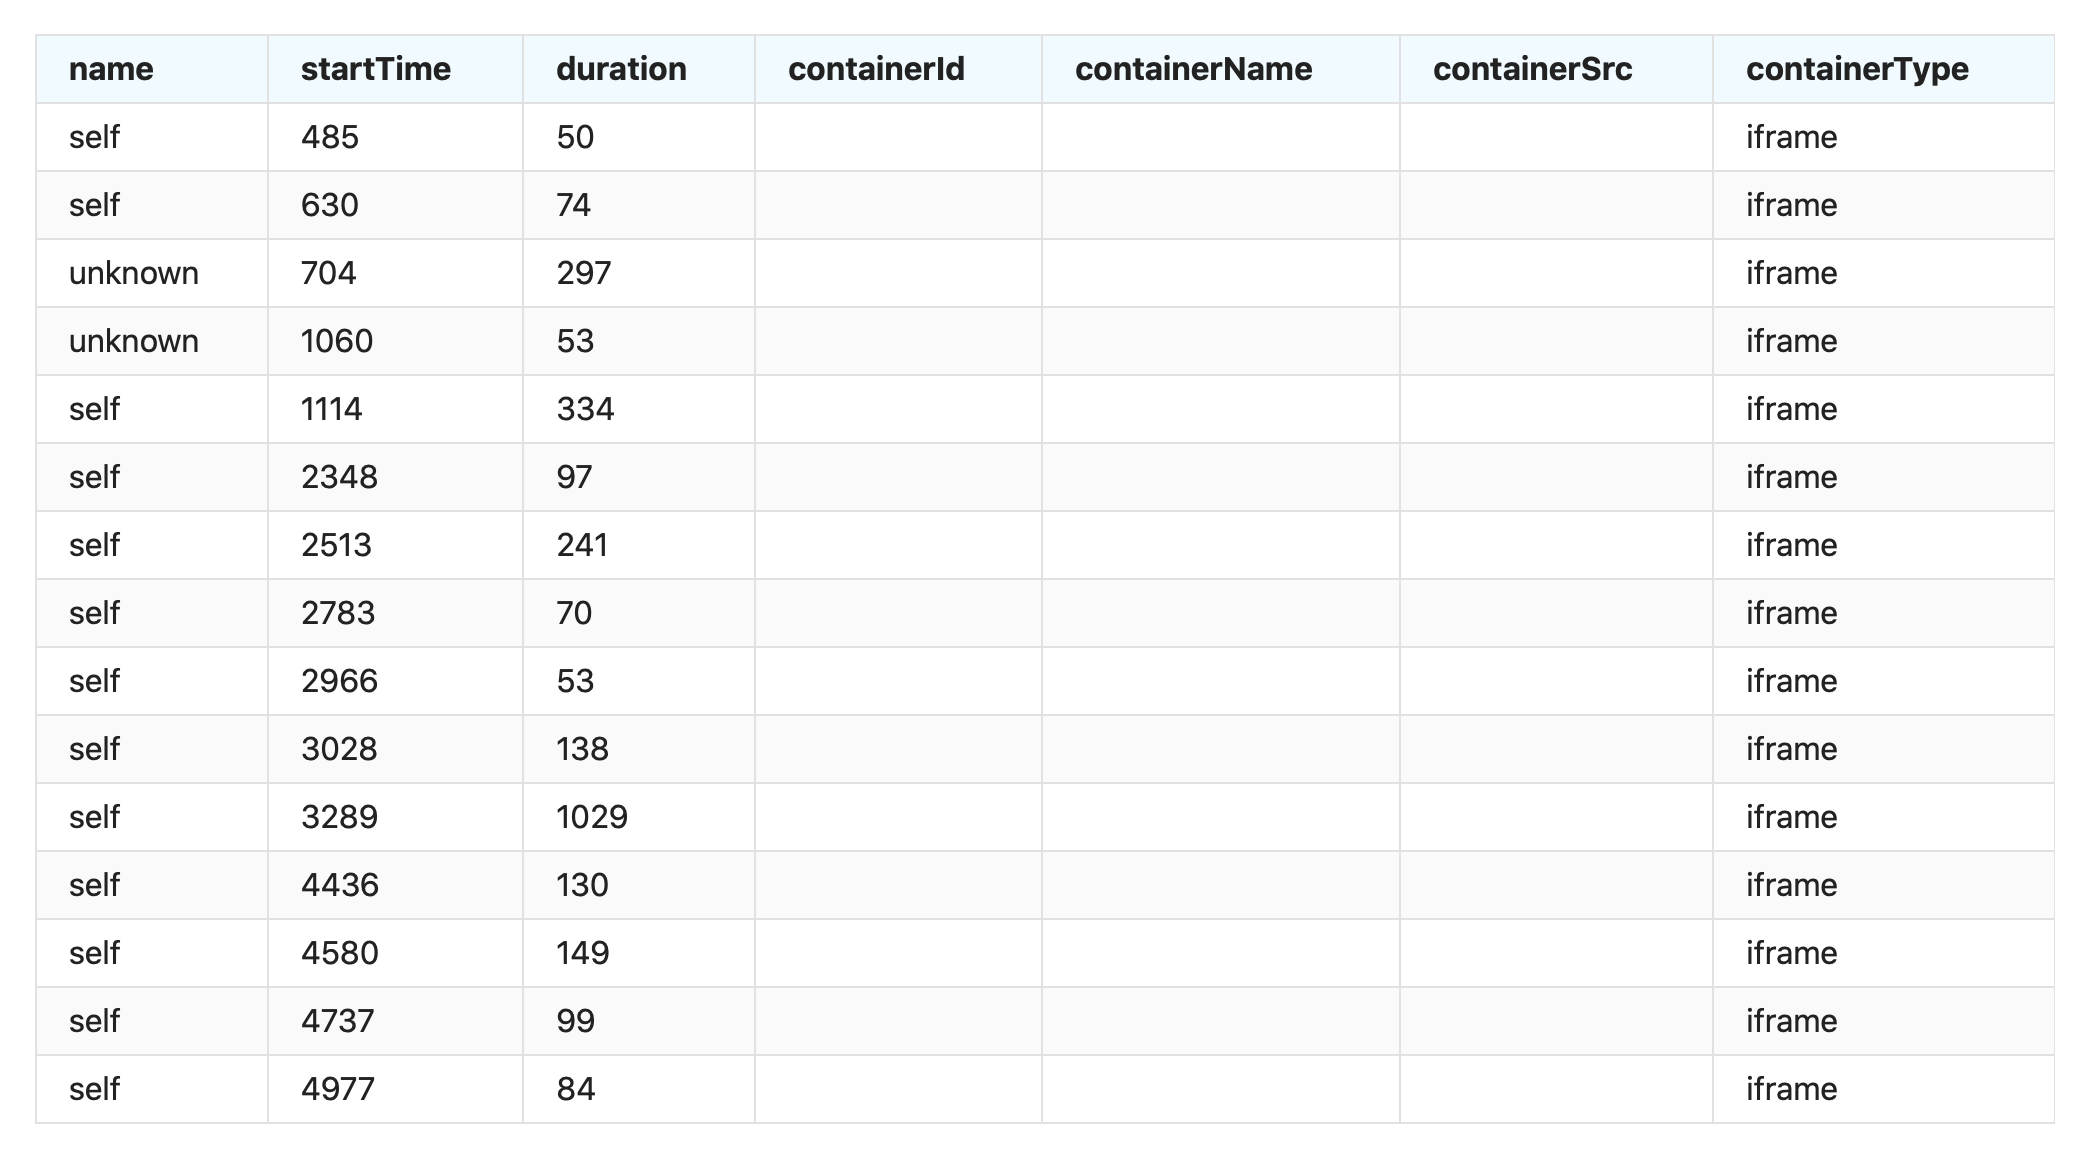
When I run a test on my Alacatel One phone, accessing https://en.m.wikipedia.org/wiki/Barack_Obama I get 15 long tasks. What is actually causing them? Well this is what you get out of the API at the moment.

We can correlate tasks if they happen before/after first paint or other browser events, but its hard to track specific code that causes them.
In our synthetic testing we collect long tasks together with the performance log from Chrome. That way when we have a long task, we load the log into Chrome devtools to find the root cause.
At the moment we run these tests on our synthetic test servers, but we want to have them in our performance mobile lab that we hope to implement soon. Using real mobile phones is important, because all CPU metrics depend on the hardware you are using.
First Input Delay
What’s First Input Delay? It measures the time from when you as a user first interact with the page (click a link/tap a button etc) to the time when the browser is actually able to respond to that interaction. This is great because we can tell if the page is slow to respond for the user.
We want to collect it from our real users (tracked in #T238091) but its quite new so we haven’t had the time yet.
The First Input Delay supports the buffered flag, meaning we don’t need to implement it in our head tag. That is good. The problem, again, is attribution. You can see that the user clicked with the mouse but there’s no information about where the user clicked. There are ways to instrument that as Gilles showed us in tracking down slow event handlers. But it would be cool if the API could give us that automatically.
If we look at what information we can get from the API it looks like this:

We know what the user did but we don’t know where they tried to interact.
I’ve tried measuring input delay directly on pages using a synthetic test: it works but it’s hard to time your input so it runs when the browsers main thread is busy and it takes time to test all different inputs that we have on Wikpedia. That’s why first input delay is a really good RUM metric.
But there’s a way to get a feel of what kind of delay you can have in synthetic testing and that’s the max potential first input delay. That metric gives us the worst potential delay without interacting with the page by taking the largest long task that happens after the first contentful paint (with the idea that the user may want to interact with the page since something is displayed).
We measure that today in our synthetic testing but it’s always best to run on real devices. When I test on my Alcatel One phone five times accessing https://en.m.wikipedia.org/wiki/Barack_Obama the max potential first input delay is between 876-1091 ms.
That’s slow. Or is it? It’s hard to tell. Let us compare with Google.com. Doing five runs on the same phone gives a max potential input delay between 443-512ms.
There’s a problem here: parsing JavaScript on a slow device takes time! And in our case we paint early and the long tasks happens late (and is long) so that works in our disadvantage. We have work here that needs to be done. Hopefully we can tell you more about it next year in the performance calendar.
