

Matt Zeunert (@mattzeunert) is the founder of DebugBear, a site speed monitoring service.
Lab-based performance tools run tests on a throttled network connection. This allows them to produce more consistent test results and capture how a page would load for users on a slow mobile connection.
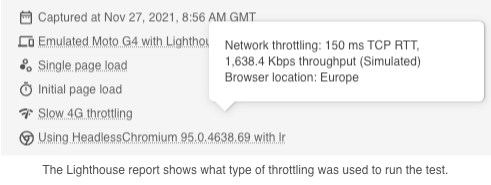
While Lighthouse supports several different throttling methods, the default used by tools like PageSpeed Insights is simulated throttling.
Lighthouse first collects data on how the page loads on a fast connection. Then it analyzes the performance recording and calculates how the page would have loaded on a slower connection.
This article will take a closer look at how this works and explore the advantages and disadvantages of this approach.
An example of simulated throttling
Let’s look at an example of how Lighthouse takes metrics collected on a fast connection – called the observed metrics – and transforms them into slower simulated metrics.
A Lighthouse test consists of two steps:
- Load the test URL in Chrome and gather data (“Gathering”)
- Simulate a slower network connection and interpret the results (“Auditing”)
We can run each step separately to understand how simulated throttling works. The Lighthouse CLI supports a -G flag that saves the raw gathered data.
lighthouse https://doh.gov.ph/ -G
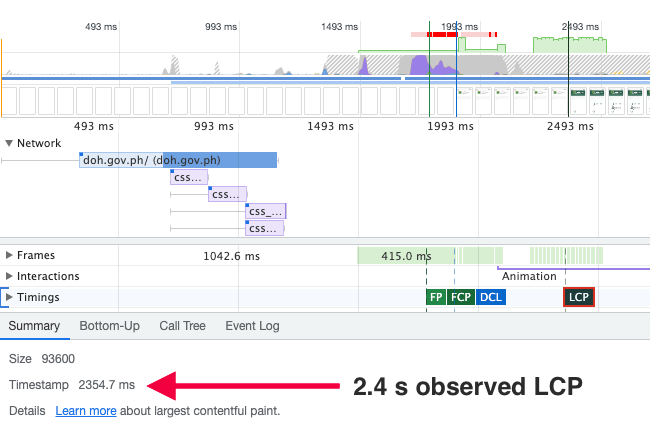
Now there’s a ./latest-run/defaultPass.trace.json file in our working directory, and we can drag it into the Performance tab of Chrome DevTools to view the trace data.
This shows us that the observed Largest Contentful Paint occurred after 2.4 seconds.
Next, we use the -A flag to run the auditing step on the saved data and generate a Lighthouse report.
lighthouse https://doh.gov.ph/ -A --view
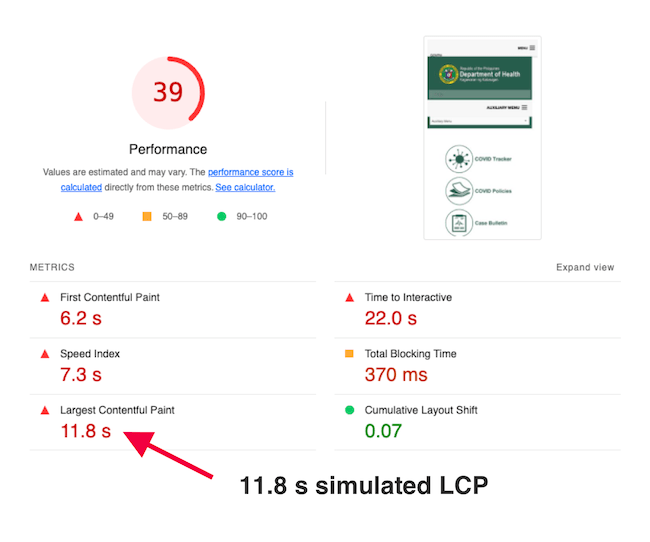
While the LCP occurred after 2.4 seconds in the original data, the Lighthouse report shows that the page would have taken 11.8 seconds to render on a slower mobile connection.
How simulated throttling works
So, how did we go from the low observed LCP to the higher simulated metric value?
Analyzing the original data
First, Lighthouse analyzes the data performance recording. Here are some things it finds out:
- The lowest network round trip latency was 4 ms – we’ll assume that this is the network latency of the device where the test was run
- On top of that, each origin has additional round trip latency, for example 152 ms for doh.gov.ph (which would make sense since I’m in the UK and this website presumably isn’t hosted there) or 2 ms for fonts.googleapis.com (which presumably uses a distributed CDN)
- The median server response time for HTTP requests on each origin (for doh.gov.ph this varies between 4 ms and 196 ms, with a median of 14 ms)
Breaking down each request into separate components forms the basis of the throttling simulation. Later, Lighthouse can adjust the round trip times and estimate how this would impact the performance metrics.
Generating a dependency graph
A rendering milestone like the First Contentful Paint depends on a number of events that have to happen before it. For example, maybe the browser needs to load an HTML document and a stylesheet before the page renders.
The FCP depends on the stylesheet, and the stylesheet depends on the document. Lighthouse generates dependency graphs to represent these relationships, and they look like this:
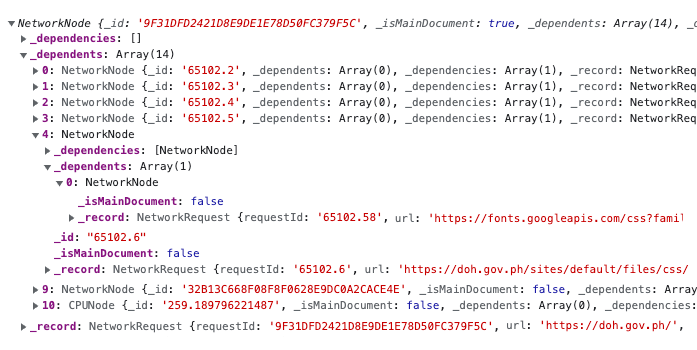
- The root NetworkNode is the main document request – accordingly it has no dependencies but a lot of other nodes depending on it
- The document triggers a bunch more requests, including a CSS file
- The CSS file has a dependency of its own, a Google Font
- In addition to NetworkNodes there are also CPUNodes that block rendering
Sometimes it’s hard to tell what resource depends on which other nodes. So Lighthouse actually generates two dependency graphs for each metric, an optimistic and a pessimistic one.
In our example, the optimistic LCP dependency graph includes a total of 123 dependencies, while the pessimistic graph has 136.
Simulation: introducing throttling to the dependency graphs
Lighthouse now has the following information:
- Connection characteristics like origin latency
- What requests block LCP
- The simulated throttling settings we want to use (usually 150 ms round trip latency and 1.6 Mbps bandwidth)
We’re ready to simulate the page load by going through the LCP dependency graph and replaying each node with slightly different settings.
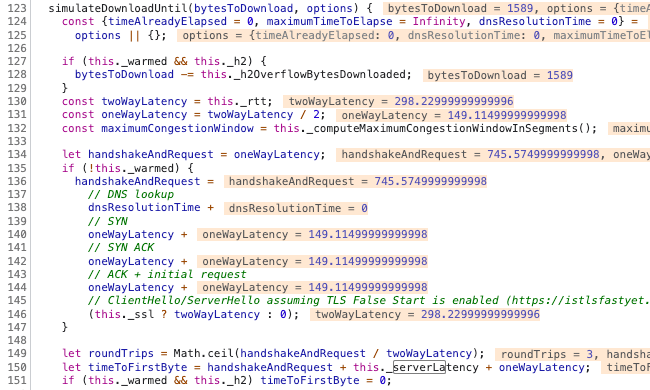
For example, each time Lighthouse runs into a new network origin it creates a new TcpConnection instance that combines the throttling settings (_options) and the collected origin data (additionalRtt, responseTime).
const connection = new TcpConnection(
  this._options.rtt + additionalRtt,
  this._options.throughput,
  responseTime
);
If you want to learn more, the TcpConnection implementation is also very interesting.
Simulated CPU throttling works the same way, the duration of each CPU node is multiplied by the CPU throttling factor (usually 4x on mobile).
Averaging optimistic and pessimistic estimates
We end up with an optimistic LCP estimate of 10.0 s and a pessimistic estimate of 13.6 s. These two numbers are averaged to 11.8 s – the number we see in the Lighthouse report.
What simulated throttling can do
Why not just throttle the network, load the page, and collect the metrics directly? Running tests on a fast connection is a lot quicker:
[Project] Lantern set out to remove Lighthouse’s dependency on network throttling and reduce the required time to compute results (previously ~40 seconds) to the same level as that of PageSpeed Insights (~16 seconds) … The accuracy of Lantern’s predictions met the predetermined correlation goals and came close to achieving the stretch goals for precision.
Simulated throttling enabled PageSpeed Insights to be powered by Lighthouse from November 2018. Not only do simulated tests run faster, they also avoid timeouts and reduce variability between tests.
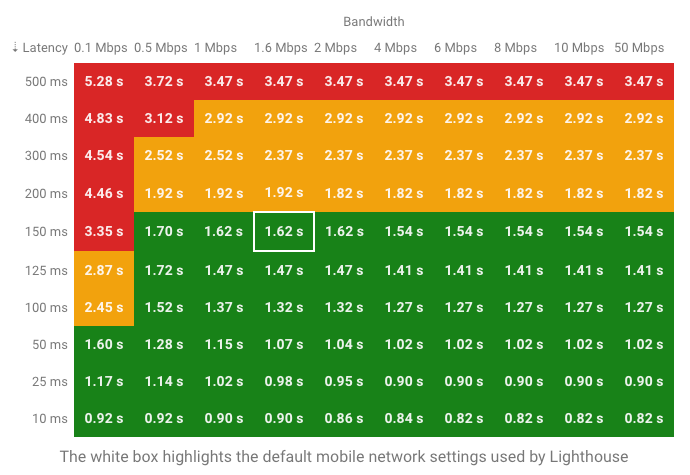
Being able to run tests really quickly also makes it possible to test how different network speeds would impact performance metrics. I recently built a tool that runs the Lighthouse simulation with many different network settings.
Simulated throttling also doesn’t require admin access on the host device, or interfere with other applications. This applies to DevTools throttling too, but DevTools throttling is a lot more simplistic and inaccurate in its own ways. Throttling the network at the system level is a lot less convenient, but the most accurate. I wrote more about the differences between these throttling methods here.
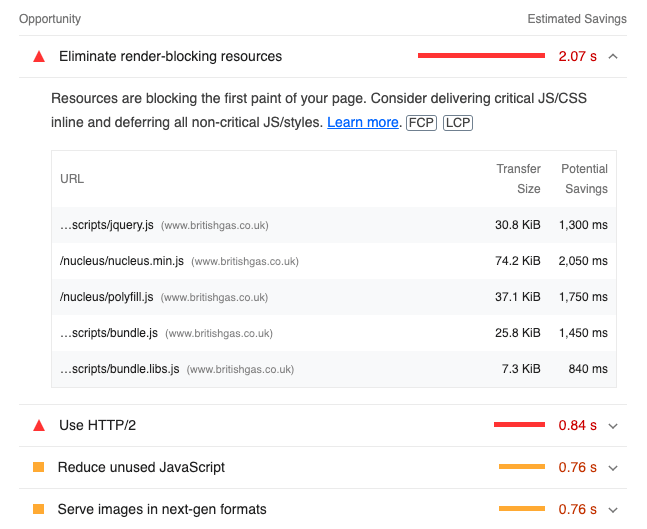
Finally, simulated throttling powers some of the savings estimates in the Lighthouse report. For example, the render-blocking resources audit runs a simulation on the optimistic FCP graph with some nodes excluded.
Limitations of simulated throttling
The big downside of simulated throttling is that it can introduce inaccuracies.
For example, earlier we saw that Lighthouse saves the median server response time for each origin. This reduces variability between tests. But if there’s a single slow render-blocking request that shares an origin with several fast responses then Lighthouse will underestimate page load time.
Lighthouse averages optimistic and pessimistic estimates when it’s unsure exactly which nodes block rendering. In practice, metrics may be closer to either one of these, depending on which dependency graph is more correct.
Lighthouse doesn’t always accurately simulate preload tags, understating the negative performance impact they can have. When I see PageSpeed Insights field data that’s worse than the lab data this is the most common reason.
HTTP/2 response times are also sometimes simulated inaccurately.
Observed metrics in the Lighthouse report
Each Lighthouse report includes the original observed values in the metrics audit JSON. You can find it in the DevTools console, or through the Network panel in PageSpeed Insights.
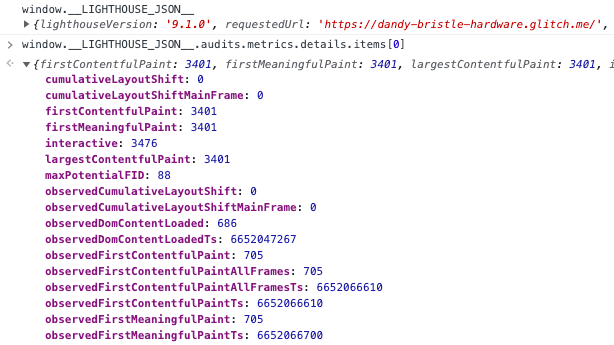
If observed metrics are slower than the throttled values that usually suggests a problem with the simulation.
Conclusion
Simulated throttling makes it possible to run tests quickly while still reporting how the page would load on a slow connection. The trade-off is that it can sometimes result in inaccurate metrics being reported.