

Tim Vereecke (@TimVereecke) loves speeding up websites and likes to understand the technical and business aspects of WebPerf since 15+ years. He is a web performance architect at Akamai and also runs scalemates.com: the largest (and fastest) scale modeling website on the planet.
Noisy RUM data can ruin your day!
Although I am a RUM (Real User Monitoring) proponent there is one downside!
The danger that noise negatively impacts your technical performance analysis.
This blogpost covers 3 filters to cancel out noise to avoid:
- Missing actual performance degradations or improvements
- Over or underestimating the impact of changes
- Being blind for the actual bottlenecks you need to tackle
I’ll use examples of my own site (scalemates.com, the largest scale modeling website) in combo with aggregated data from rumarchive.com (publicly available and queryable dataset of anonymized RUM data).
Human Visible Navigations
To avoid noisy RUM data I typically focus on Human Visible Navigations (HVN) and filter out the rest.
On scalemates.com the filtered noise is 22% of all collected page views.

The removed data is not relevant for what we typically discuss, assume and even understand as being “The performance of a site”.
Human Visible Navigations are those experiences we actually care about when talking about the speed of our sites:
- Human: We exclude noise coming from bots and synthetic measurements polluting the Human RUM data we care about.
- Visible: We exclude any partial or fully hidden experiences. These tend to be very slow and users don’t see this slowness.
- Navigations: Exclude back-forward navigations which are lightning fast and polluting our numbers.
The next sections talk in more detail on the impact of this noise on your data. It might be bigger than you think?
Filter #1 Navigation Types
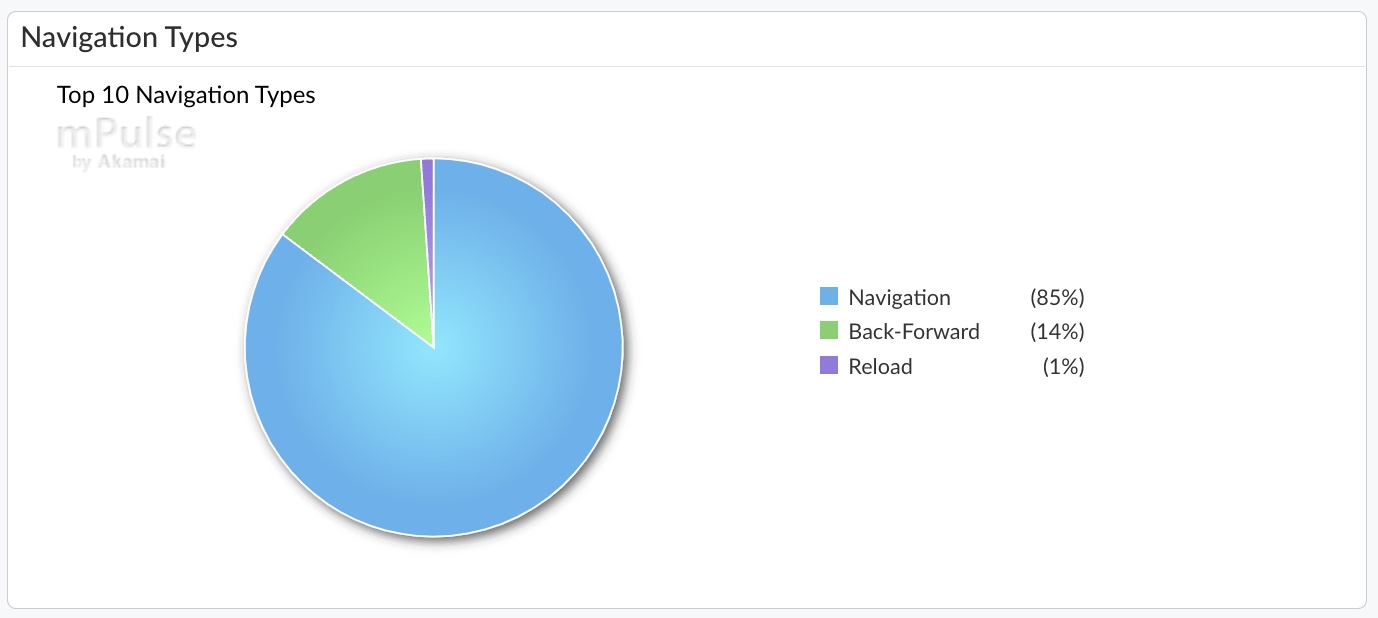
A quick look at RUM data for scalemates.com shows the following distribution of navigation types (see PerformanceNavigationTiming) :
- Navigations (85%)
- Back-Forward (14%)
- Reload (1%)
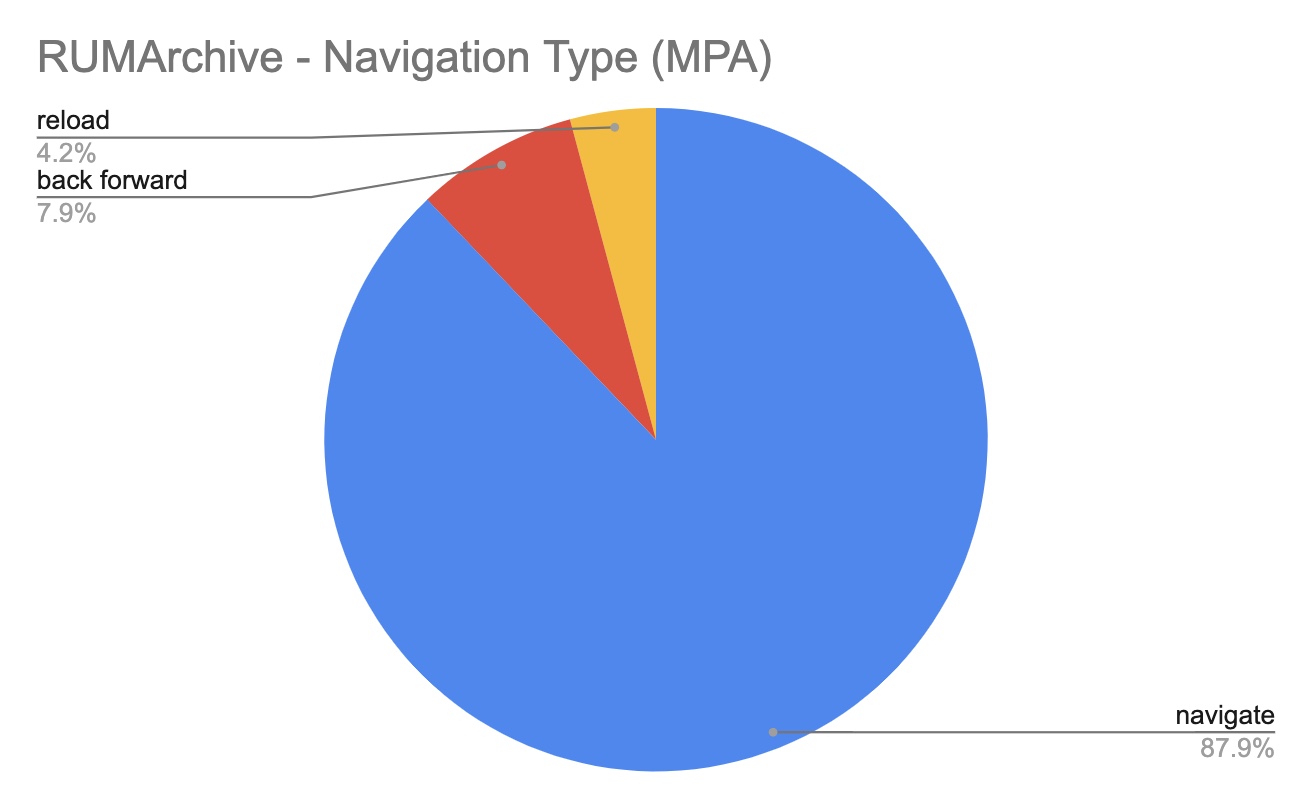
Different websites have different patterns, the RUMArchive data set for Multi Page Apps shows different numbers:
- Navigations (88%)
- Back-Forward (8%)
- Reload (4%)
Performance impact
Different navigation types means different performance! The histogram below clearly shows the belly of back forward navigations (blue) is positioned more to the left (=faster) compared to regular navigations (Red).
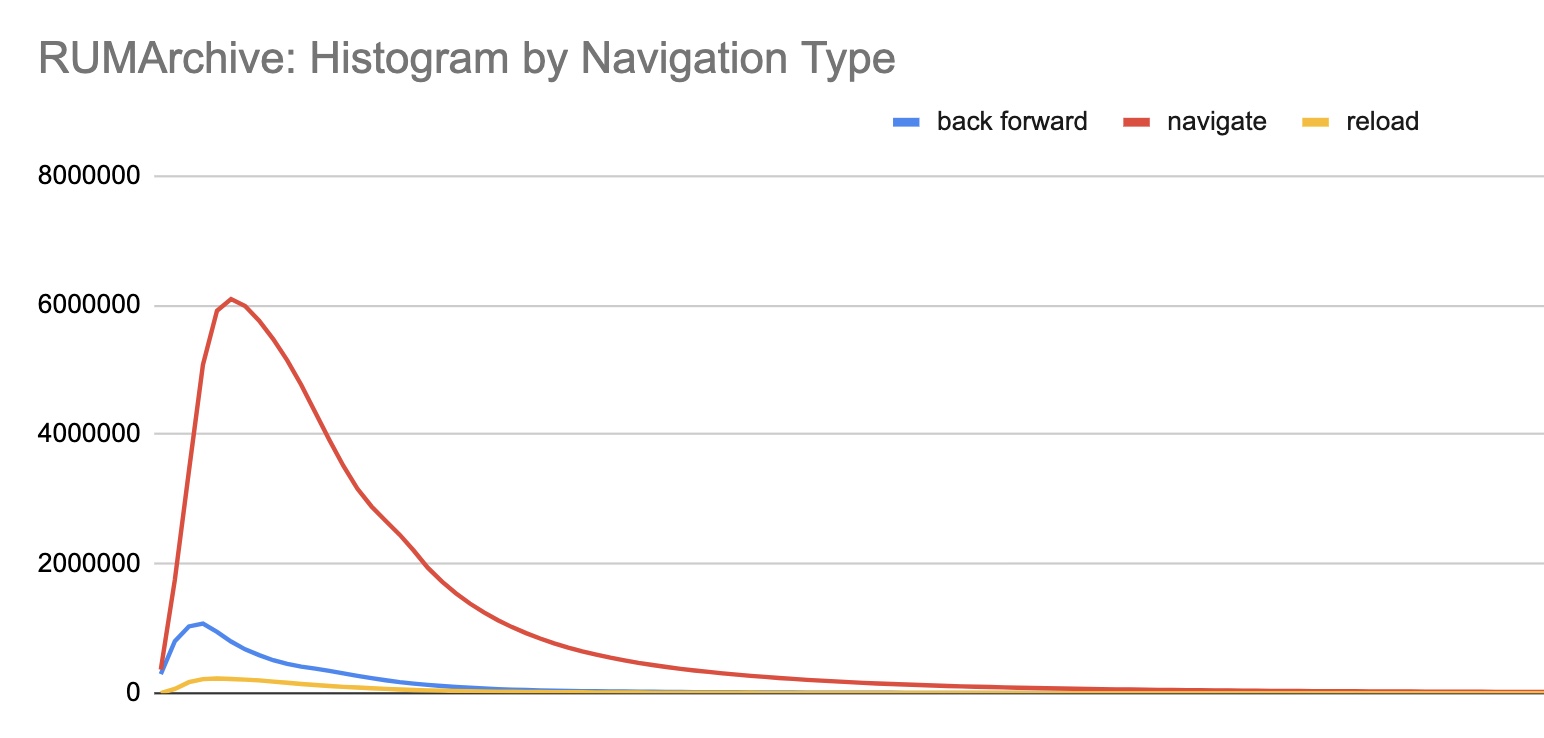
This substantial performance difference can skew your data. Looking at this specific example on scalemates: The Total Median Waiting Time (83ms) is influenced by the lightning fast Back-Forward Navigations (4ms). While tuning performance at the CDN or CMS level only impacts the actual Navigations (96ms)

Noise reasoning
Back forward navigations are noise adding a significant amount of fast measurements to the lower percentiles.
Typically when talking about the speed of a site we don’t include the above super fast back forward navigations.
Many performance optimisations have no impact on back forward navigations. Doing an analysis including those data points makes your life harder.
Note: For certain KPIs the recommendation should not be filtered out. Take for example Cumulative Layout Shift which are visible and can be influenced on all types of navigations.
Noise fluctuations:
- Different page types have different noise levels: My product listing pages show more Back-Forward navigations than an Article page.
- The impact of navigation type noise depends on how fast/slow your pages are.
The main point is:
If you only focus on “Navigate” and ignore the noise (back-forward, reload) your technical analyses will be easier.
TLDR
- Recommendation: Only look at “navigate”
- Filter impact: Reduces noise on median and lower percentiles
- Noise: Reload and back forward navigations
- Noise size:
- 15% (scalemates.com)
- 12% (RUMArchive)
Filter #2 Visibility States
This Pie-Chart shows the distribution of three Visibility State buckets on scalemates.com:
- Always Visible (94%)
- Always Hidden (6%)
- Partially Hidden (0.07%)

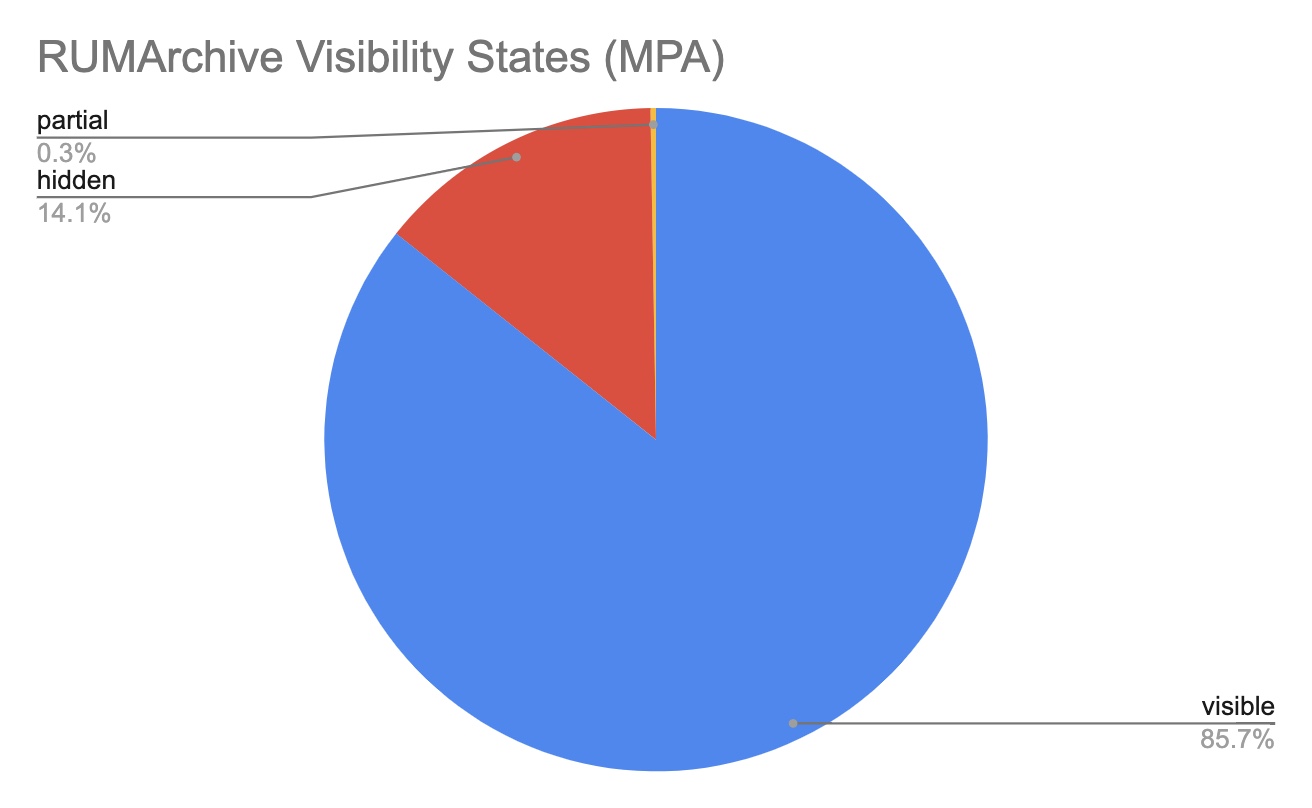
Looking at the aggregated RUMArchive data we see this distribution:
- (Always) Visible (85.7%)
- (Always) Hidden (14.1%)
- Partial(ly Hidden) (0.3%)
Performance impact
A page loaded in the background can show a substantial difference compared to one loaded in the foreground. As soon as a page is loading in the background (eg. different tab) the browser deliberately deprioritizes activities resulting in degraded performance KPIs.
This performance degradation is out of our control and is not really impacting end users.
Here you see the 98th percentile of Largest Contentful Paint (LCP) by visibility state. Both Always Hidden (8.00s) and Partially Hidden (13.20s) are significantly higher and skew the overall number to 4.89s while we only care about the 4.75s.
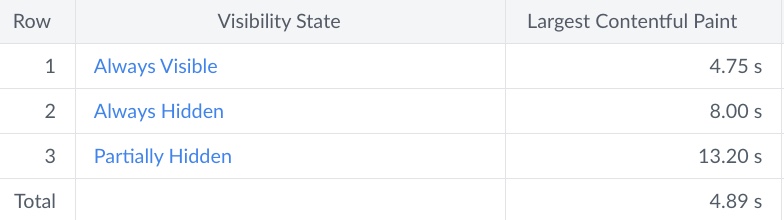
Including this slow data in your analysis prevents focussing on the actual outliers (p98, p99)
Paul Calvano wrote a full blogpost in 2021 with more analytics and data: Page Visibility: If a tree falls in the forest…
The main point is:
If you only focus on “Visible” and ignore the noise (hidden, partially hidden) your analyses will be cleaner.
TLDR
- Recommendation: Only look at “visible”
- Filter impact: Reduce noise on highest percentiles (95+)
- Noise: hidden + partial visibility states
- Noise size:
- 6% (scalemates.com)
- 14% (RUMArchive)
Filter #3 Bots
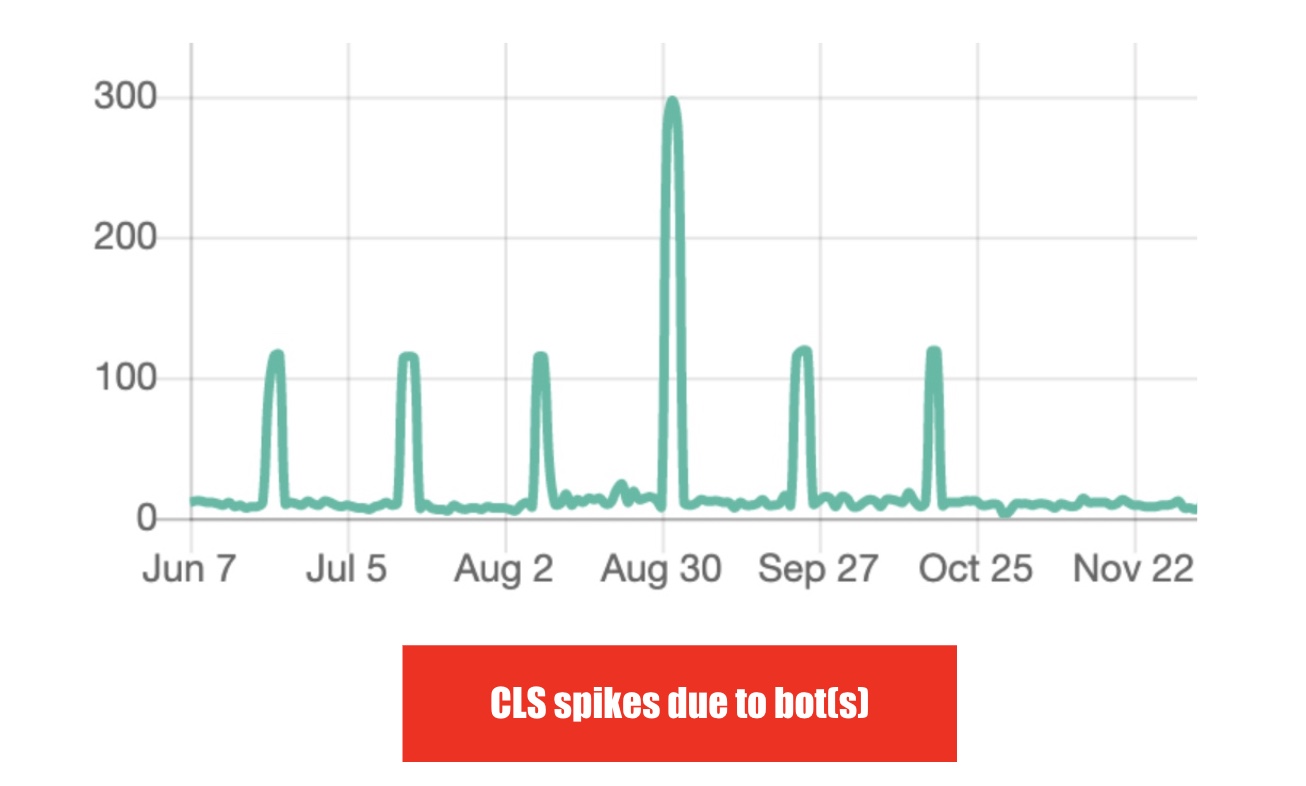
Avoid polluting actual user performance with unpredictable, unnatural and spiky bot traffic.
As an example: Here you see the impact on CLS at times when a particular bot scraped the site every few weeks. In this case the bot used an old Chrome User Agent triggering older CLS issues. If such a spike collides with a deploy you could end up rolling back for an invalid reason.
Note: RUMArchive does not include Bot Traffic
Key message: Avoid unexpected results and filter out Bots by default, no matter how low or high the noise is.
TLDR
- Recommendation: Only look at humans (excluding all bots)
- Filter impact: Reduce overall noise (all percentiles, fluctuations)
- Noise size: 1% (but fluctuates from 0 to 10% based on day)
Why actually measure them?
Although I recommend filtering noise during a typical analysis, it does not mean the data is never ever relevant!
This noise can be a signal as well:
- For certain non timer based KPIs like CLS the back-forward navigation is relevant. Layout shifts when clicking the back button is a common performance issue and should be tackled.
- The percentage of pageviews with Visibility State hidden can be an indicator for underlying performance issues.
- Detecting strange bot behaviours in RUM can help protecting your data against scrapers.
RUMArchive queries
A special Thank You to Kevin Farrugia. Kevin wanted to gain some experience with exploring the RUMArchive and assisted me getting the aggregated data. Here is a collection of his queries and results. github.com/kevinfarrugia/rumarchive
Summary
Don’t waste time listening to noise and zoom in on Human Visible Navigations (HVN).
Canceling noise results in more info out of your data:
- Fewer changes staying below the radar
- Fewer fluctuations
- Fewer blindspots when finding bottlenecks
- Better correlation with business metrics
- Easier to understand data