

Annie Sullivan (@anniesullie) is a software engineer on Chrome's Web Platform team. She is passionate about building a better performing web for users across the globe. Her tenure as a Googler spans 18 years, with experience on the toolbar, docs, web search, and chrome teams. Annie currently leads performance metric development on Chrome. She lives in Michigan with her husband Doug and two sons, and enjoys tinkering with electronics, cooking pizza, and doing American ninja warrior obstacles with her kids.
Introduction to Chrome tracing
What is a Chrome trace?
If you’re just getting started learning about tracing, you should read this fantastic introduction from the Perfetto tracing documentation. I like their definition:
Tracing involves collecting highly detailed data about the execution of a system. A single continuous session of recording is called a trace file or trace for short.
The article goes on to explain that traces contain enough data to construct a timeline of events. Chrome traces contain all sorts of data, both high level and low level. Some examples include:
- Network logs
- Rectangles showing the coordinates of layouts and paints
- Information about Core Web Vitals metrics
- JavaScript sampling profiler data
The Perfetto article mentions that application code is instrumented. In Chrome, the TRACE_EVENT macros are used throughout the code to instrument wherever an engineer wants trace data. The number of different types of data combined with the fact that anyone can add trace events means there is an enormous amount of trace data. To help manage this, traces are logged with a category. If you are recording a trace in perfetto or the old chrome://tracing UI you can select which categories to record to narrow down the data to just things you care about. But most web developers instead choose to trace through the DevTools Performance Panel, which selects a set of categories on your behalf.
Tracing through the Devtools Performance Panel
When you record runtime performance in Chrome DevTools, you’re recording a trace. And recording a trace this way has some ergonomic benefits for web developers over perfetto and the chrome://tracing UI:
- The trace will only include info from the current tab. Normally Chrome traces include information from all of Chrome’s tabs, as well as other processes like the ones that show Chrome’s UI.
- The performance panel automatically only enables trace categories relevant to web developers, so you don’t need to comb through the long list of category names and guess the ones that might be useful.
- The performance panel UI is tuned for web developers. It shows screenshots of what the page looked like throughout the recording. It includes a visualization of JavaScript execution measured via CPU sampling (flamecharts, top-down, bottom up charts, etc.). Overall, it’s designed to focus on the most common problems of web pages instead of Chrome internals.
So you can view traces right from DevTools. When would you want to use a different viewer? The main reason is that sometimes you just get a big blank gap in the performance panel trace, because the performance problem is in a Chrome system which isn’t in the list of categories DevTools has enabled in tracing. There are some great articles about this situation; one by Nolan Lawson and one by Jeremy Rose. But starting from Chrome 103, there is a new experiment to enable more of the non-DevTools relevant tracing events. Note some very slow or prolific events (those in the internal disabled-by-default categories) will not be included even with this setting, and experiments may be removed in the future. You can turn it on in the experiments section of settings:
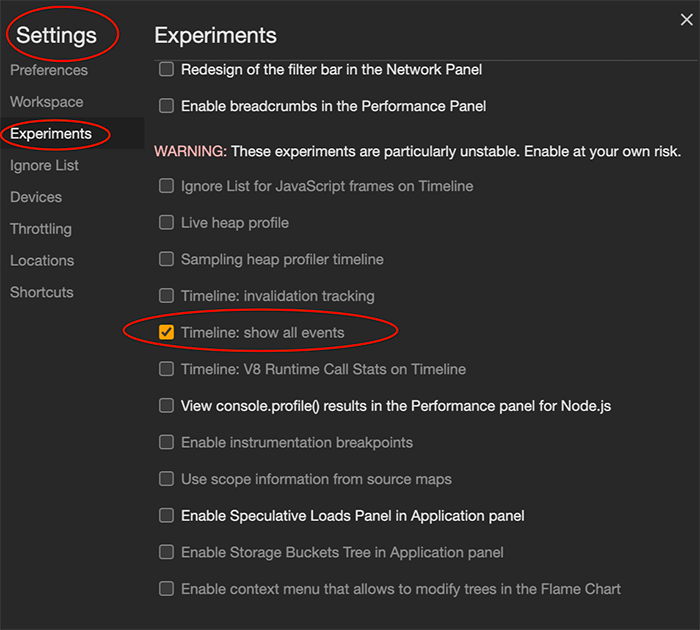
Definitely enable this setting if you’re seeing blank gaps in DevTools performance panel!
Tracing through chrome://tracing and perfetto UI
As mentioned, even with this flag on, DevTools performance panel traces don’t include the disabled-by-default events, which can generate a large volume of data and have a big performance impact while they are running. To view those, you need to turn to alternative tracing tools.
There are some other reasons you might want to use a different trace viewer. Maybe you really do want to see multiple tabs in one trace. Maybe you want to have a more chromium-focused view, where you can easily link events back into chromium source code. Maybe you want to search and query events faster. Maybe you want system tracing events from the OS.
You may have heard of chrome://tracing, and if you have used that in the past, then you can still use it for these things. But especially if you’re just learning, you should be aware that chrome://tracing is deprecated in favor of Perfetto, which is faster, more stable, has an easier to use UI, and has much better support for custom metrics and queries. If you’re interested in tracing, I highly recommend reading the docs, or you can just go ahead and use the quickstart guide to recording Chrome traces in Perfetto.
Tracing though WebPageTest and other automated tools
You can also collect traces from WebPageTest runs! You can see the configuration options under the Chromium tab in the Advanced configuration options:
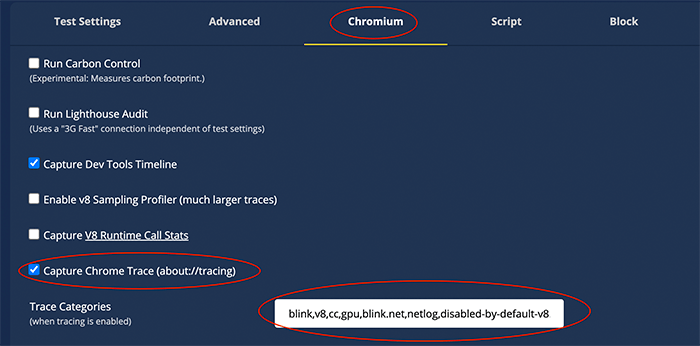
You type in a comma-separated list of tracing categories. The tracing categories are the same ones you check when starting tracing in Perfetto. The resulting trace will be linked in the first column of each individual run:
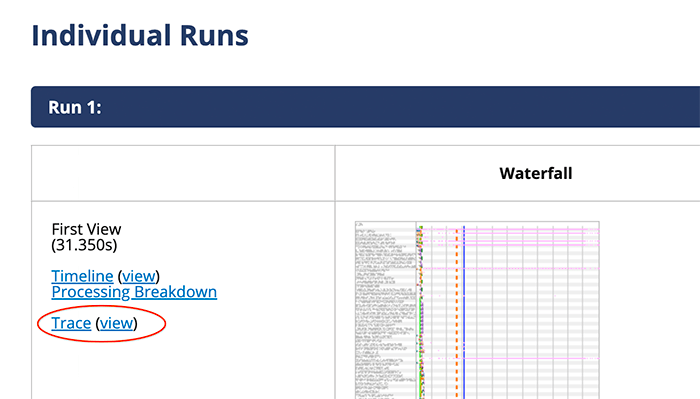
WebPageTest is amazing for performance automation, and you can even use this extension to export a recorder session as a WebPageTest custom script. But if you want to write your own tool to automate collecting traces, you can collect traces using the Chrome DevTools Protocol with automation tools like Puppeteer, Selenium, or Playwright.
Trace file format
Originally Chrome recorded traces in the Chrome JSON format, containing a long array of events. Now when you record a trace in Chrome, internally it uses Perfetto’s protocol buffer based format. This enables Chrome to record traces with lower overhead and a larger event buffer. But if you want to poke at the files manually or in a web app, JSON is easier. When you download from the Chrome DevTools, you get the Chrome JSON format, and Perfetto traces are easy to convert. I’ll give some info on the JSON file format and different ways to poke through trace files in my example app below.
Processing Chrome JSON Traces: A small custom application
The application
As my team works on the new soft navigation metrics, I really wanted an easy way to analyze a captured trace file, visualizing when soft navigations are detected and the paint events afterward. I’ll walk through how I built it and some things I learned about poking at traces and paint events along the way.
What I found myself wanting to do a lot when working on understanding how soft navigation detection and follow up paints are working is the following:
- Open up DevTools performance panel and start recording
- Do one or more soft navigations on the page
- Look at a timeline that’s focused on those soft navigations: which were detected? When did they start? What paints did the API report as Largest Contentful Paint candidates?
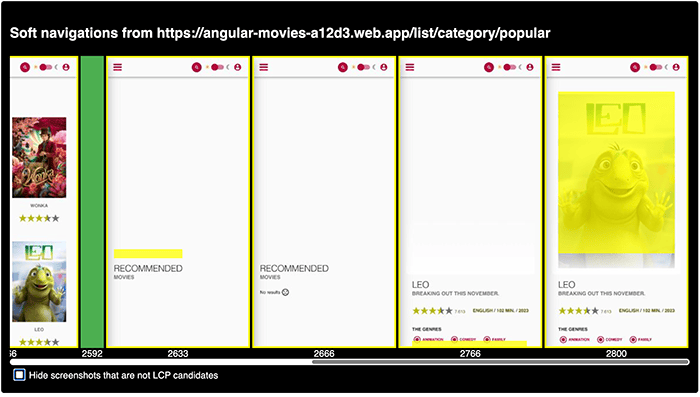
If you want to try out the finished tool, you can use it here or view the source code here. The screenshot below shows an example of the timeline it generates when you give it a trace:
- It shows timestamps in milliseconds since page load at the bottom.
- It highlights the starts of soft navigations in green
- It highlights the Largest Contentful Paint candidates in yellow
- Hovering over the soft navigation start and LCP candidates provides more details.
Choosing a trace file format and UI
Perfetto is an amazing tracing system with tremendous capabilities. But for this particular project, when I looked at my requirements I felt the DevTools performance panel traces are best for this use case instead of Perfetto because:
- I am only focusing on one web page at a time. I want to start and stop recording in the same tab while I’m interacting with that page, and DevTools performance panel is set up for that use case.
- I want to look at filmstrips, and DevTools is already recording what’s needed for filmstrips.
- If this tool turns out to be useful for reporting bugs and discussing subtleties of soft navigations, I want to make it easy for web developers to use, and DevTools helps with that.
- I want to quickly look at many mobile websites, and DevTools mobile emulation supports that use case.
- I want to make my viewer using HTML and JavaScript, and the Chrome JSON format that DevTools saves makes that easy.
Chrome JSON trace basics
As I mentioned before, the trace files have an array of events. When saved from DevTools it looks like this, one event per line and arguments in alphabetical order:
{"traceEvents": [
  {"args":{"argName":"argValue"...},"cat":"comma,separated,category,names","name":"eventName","ph":"M","pid":0,"tid":0,"ts":0},
  ...
]}
Here are the fields in every event:
args: an event-specific dictionary of key/value pairscat: a comma separated list of the trace categories for this eventname: the name of the trace eventpid: the id of the process this event occurred in. You can read more about Chrome’s multi-process architecture here, but it’s okay to ignore in devtools traces if you’re just getting started.ph: each event type has one or more phases, explained in this old documentation. We can ignore these for our example today, but the doc has details on more complex event types.tid: the thread id of the thread this event occurred in. You can also read more about it in the above link about Chrome’s multi-process architecture.ts: the timestamp when the event was emitted. Timestamps are in microseconds.
To make the UI above, I’ll need to find several things in the trace:
- When do soft navigations happen?
- What are the subsequent largest contentful paint candidates?
- Can we show them on the filmstrip screenshots we see in DevTools performance panel?
So we’ll want to find events that have info on soft navigations and largest contentful paint candidates, and also the filmstrip screenshots. The easiest way is to search for event names and look at their args to see what details they contain. Let’s start digging!
Using grep or Ctrl+F
Since the trace files are JSON, you can easily grep or jq on the command line or use Ctrl+F to find what you’re looking for in your editor of choice. I prefer to do the latter since the trace can have very long lines. I format the trace in VSCode; you can do the same in your editor of choice or use an online pretty printer. I’ll show the pretty-printed results I see when I search the text. If you want to follow along with the exact trace I used, you can find it pretty printed or with the default event-per-line formatting in the GitHub repo for the project.
First: where are the soft navigation events? Ctrl+F and start typing! By the time I typed “softna” my search has narrowed down to a few events in my trace that look like this:
    {
      "args": {
        "frame": "2D636F83A7E185549B7E7C07168FB95D",
        "navigationId": "4a69b464-1e72-4cfa-a50d-3786ecf6387e",
        "url": "https://m.youtube.com/@MrBeast"
      },
      "cat": "scheduler,devtools.timeline,loading",
      "name": "SoftNavigationHeuristics_SoftNavigationDetected",
      "ph": "I",
      "pid": 69051,
      "s": "t",
      "tid": 259,
      "ts": 193220148841,
      "selfTime": 0
    },
Looking at it, each one is a soft navigation. We can see that:
tsis the timestamp of the navigationargs.urlis the URL being navigated toframecontains the frame this occurred in; if we’re digging into pages that have iframes we can account for this but let’s start by assuming everything’s in the main frame.navigationIdis a unique id for each soft navigation
Having a unique id for each soft navigation might mean we can associate it with the paints! Let’s Ctrl+F 4a69b464-1e72-4cfa-a50d-3786ecf6387e and find out! There are three matching events; I’ll paste just the final one (final candidate) for brevity:
     {
      "args": {
        "data": {
          "candidateIndex": 3,
          "imageDiscoveryTime": 7296.5,
          "imageLoadEnd": 7299.5,
          "imageLoadStart": 7297.5999999940395,
          "isMainFrame": true,
          "isOutermostMainFrame": true,
          "navigationId": "4a69b464-1e72-4cfa-a50d-3786ecf6387e",
          "nodeId": 2229,
          "size": 24250,
          "type": "image"
        },
        "frame": "2D636F83A7E185549B7E7C07168FB95D"
      },
      "cat": "loading,rail,devtools.timeline",
      "name": "largestContentfulPaint::Candidate",
      "ph": "R",
      "pid": 69051,
      "s": "t",
      "tid": 259,
      "ts": 193220415759
    },
Looks like these are exactly what we were hoping for, Largest Contentful Paint candidates 1, 2, and 3. Looking at args.data, we can see the first two are type text and the last is type image. They each have a size, which is width x height, but they don’t have any coordinates we could use to paint a screenshot. However they each have a nodeId; let’s look for that! If we just Ctrl+F and type “2229” we’ll get a lot of partial matches in timestamps. But we can use regular expression search, or just search for ” 2229,”. The node id shows up in several unrelated events like PageEvacuationJob started and ProfileChunk, but we also see this:
    {
      "args": {
        "data": {
          "dom_node_id": 2229,
          "frame": "2D636F83A7E185549B7E7C07168FB95D",
          "image_url": "https://yt3.googleusercontent.com/NP3n...",
          "is_image": true,
          "is_image_loaded": true,
          "is_in_main_frame": true,
          "is_in_outermost_main_frame": true,
          "is_svg": false,
          "object_name": "LayoutImage",
          "rect": [12, 52, 400, 52, 400, 115, 12, 115]
        }
      },
      "cat": "loading",
      "name": "PaintTimingVisualizer::LayoutObjectPainted",
      "ph": "I",
      "pid": 69051,
      "s": "t",
      "tid": 259,
      "ts": 193220402724,
      "tts": 18637038,
      "selfTime": 0
    },
So the args.data.nodeId from largestContentfulPaint::Candidate matches args.data.dom_node_id in PaintTimingVisualizer::LayoutObjectPainted. But it’s hard to find automatically because they have different names. And taking a step back, they use different naming conventions too (camelCase vs underscores). An important thing to keep in mind with traces is that they have tons of data because it’s easy for any engineer to add data, but different engineers and especially different teams don’t necessarily coordinate on trace events. So you’ll see issues like this with inconsistent naming, and even inconsistent ways to represent a rectangle, as we’ll see below.
Searching chromium codebase for details
PaintTimingVisualizer::LayoutObjectPainted-that looks like exactly what we need! There are a lot of arguments, but what we probably want is rect. But what is a rect? Why does it have 8 numbers? This is where Chromium code search comes in handy. There’s only 1 hit in the c++ code for PaintTimingVisualizer::LayoutObjectPainted. It’s in PaintTimingVisualizer::DumpTrace(). That method has the value with the rect passed in; if we click on it we can see it’s called by DumpImageDebuggingRect and DumpTextDebuggingRect in the same file. You can see those both call RecordRects() which calls CreateQuad() which makes a rectangle:
void CreateQuad(TracedValue* value, const char* name, const gfx::QuadF& quad) {
  value->BeginArray(name);
  value->PushDouble(quad.p1().x());
  value->PushDouble(quad.p1().y());
  value->PushDouble(quad.p2().x());
  value->PushDouble(quad.p2().y());
  value->PushDouble(quad.p3().x());
  value->PushDouble(quad.p3().y());
  value->PushDouble(quad.p4().x());
  value->PushDouble(quad.p4().y());
  value->EndArray();
}
And if you click on gfx::QuadF you’ll see it defines a quad by for corners:
  constexpr explicit QuadF(const RectF& rect)
      : p1_(rect.x(), rect.y()),
        p2_(rect.right(), rect.y()),
        p3_(rect.right(), rect.bottom()),
        p4_(rect.x(), rect.bottom()) {}
So that means the values in the rectangle are:
x,
y,
right,
y,
right,
bottom,
x,
bottom
Where x, y is the top left corner and right, bottom is the bottom right corner. So now we can get the viewport coordinates for each LCP!
Writing some JavaScript to parse the trace
Now we know exactly the data we want, let’s look at some quick JavaScript code to pull out the trace data that we need. Array filter and find help a lot here:
let traceJson = JSON.parse(traceData); // traceData = file downloaded from DevTools
let traceEvents = traceJson.traceEvents;
let lcpEvents = traceEvents.filter((e) => {
  return (e.name == 'largestContentfulPaint::Candidate' &&
      e?.args?.data?.nodeId);
});
for (let l of lcpEvents) {
  let p = traceEvents.find((e) => {
    e?.args?.data.dom_node_id == l.args.data.nodeId;
  }
  let top = p.args.data.rect[1]; // or rect[3]
  let left = p.args.data.rect[0]; // or rect[6]
  let height = p.args.data.rect[5] - top; // or rect[7] - top
  let width = p.args.data.rect[2] - left; // or rect[4] - top
  // Now do something with this position!
}
Some of you might feel more comfortable diving straight into code like this to help you traverse the JSON data, rather than manually searching and grepping through it. Others may be more comfortable looking through the JSON initially, especially if you’re less used to the structure. Regardless, at some point, you’ll definitely want to switch to code. (And if you find yourself really wanting to write queries instead of grepping or array processing, that’s a great time to look at Perfetto’s trace processing and metrics capabilities.
Lather, rinse, repeat!
All right, we know the coordinates within the viewport of the paint for each LCP candidate! But if we want to draw it on top of a screenshot, we also need to know:
What the viewport size is
Ctrl+F “viewport” gives us a PaintTimingVisualizer::Viewport event with same rect format as the paint rects, making it 412×915.
What the screenshot size is
Ctrl+F “screenshot” gives a whole lot of events like this:
    {
      "args": {
        "snapshot": "/9j/4AAQSkZJRgA......"
      },
      "cat": "disabled-by-default-devtools.screenshot",
      "id": "0x1b2a",
      "name": "Screenshot",
      "ph": "O",
      "pid": 15397,
      "tid": 259,
      "ts": 11391427572
    },
But notice the screenshot event has no dimensions! The args.snapshot field is a base64 encoded png. We can either render an image in HTML with a data URI like "data:image/png;base64,/9j/4AAQSkZJRgA......" or use an image library to get its dimensions. Since my app is a web page anyway, I did the former.
Which screenshot to line up with which paint
First, the screenshot timestamp doesn’t exactly match the LCP timestamp. And if we look back, the LCP timestamp doesn’t match the PaintTimingVisualizer for the node either! The reason is that displaying a frame in Chrome is a complicated process. First code in the renderer on the main thread does layout and decides how objects will paint; this code notifies the PaintTimingVisualizer as it runs, emitting a timestamp right away. Then the Largest Contentful Paint waits for the presentation timestamp, which is when the GPU believes the pixels actually appear on screen. And the code that collects screenshots does its own estimation of timestamp. The good news is that things generally line up if we anchor on the timestamp for the LCP candidate and assume the paint with a timestamp immediately before it and the screenshot with a timestamp immediately after it are the right ones.
A simple app for a custom view into a trace
I was chatting with Andy Davies after performance.now() about poking into traces like this. He suggested that writing some JavaScript to parse the JSON and using web components to build a viewer is a quick and easy solution. I tried it and I’m pretty happy with how quickly it came together. Here is the source code. Perhaps as you were reading you noticed it doesn’t yet handle iframes, out of order frame timestamps, and other edge cases. With a viewer like this, when I hit a site with an edge case like this it is pretty clear visually, since the highlight for LCP doesn’t line up correctly. So it’s easy to adjust as I go.
You could imagine adjusting this to use the screenshots in other ways. Maybe to visualize layout shifts. Or maybe you could work on ideas for a different loading metric based on the paint events. One that measures something closer to visual completeness, or some fraction of the viewport.
What about productionizing this?
I hope this blog post was a good intro into how to poke into traces, and rearrange the screenshot and painting features into something more customized for your use case. But if your use case is something that needs to scale, you should consider broadening your tooling outside of the JSON produced by DevTools performance panel.
You may have noticed that WebPageTest has bigger screenshots than the ones produced in the traces, and it can show them at 60fps granularity. If you want to have that kind of quality filmstrip without severely impacting performance, you’ll need to video record the screen instead of dumping screenshots into a trace. That’s exactly what WebPageTest does, and you may want to consider hosting your own instance.
Also you may find that writing JavaScript code to filter and link events from an array of JSON goes from simple and easy to slow and error prone the more features you include and the larger traces you want to process. At this point you’ll really want to revisit Perfetto. Its support for trace-based metrics and SQL provides a more systematic way to filter and join traces, and its Batch Trace Processor can scale your queries to thousands of traces. It also has C++ and python libraries for processing traces.
Show us your ideas!
Often people talk to me about ideas for different loading metrics or tweaks to Largest Contentful Paint. Could we use the paint rects to measure when the entire first viewport is painted instead of just looking at the Largest Contentful Paint? Could we combine adjacent paints with some heuristic? Could we combine heuristics around network and JavaScript usage with the painted rects? I’d love to see people show me how these ideas pan out on a filmstrip. Or better yet, show the Web Performance Working Group.