Ethan Gardner (@ethangardner.com) is a full-stack engineer with expertise in front-end development, focused on creating high-performance web applications, identifying process efficiencies, and elevating development teams through mentorship.
A 300ms improvement may sound like a big win to someone immersed in web performance optimization, but for most people, mentioning milliseconds doesn’t usually resonate or seem meaningful. Whenever I’ve mentioned how we could save a few hundred milliseconds to an executive, my proposal was often met with quizzical looks and a nod to proceed, but only as a low priority. This disconnect creates friction between studies like Milliseconds Make Millions or Response Times and the anecdotal realities of many organizations worldwide.
Think back to the 2024 Summer Olympics: Noah Lyles won the 100m sprint by a historically close margin of 5ms. That was a rare margin that most people don’t encounter in their daily lives. Instead, we’re accustomed to measuring time in seconds, minutes, hours, and days. The millisecond subdivision is unfamiliar, which makes gaining traction on performance work difficult if you simply tout numeric improvements.
Be Relatable
I firmly believe in the value of web performance and how improving it can positively impact the user experience. However, any time I wanted to focus on performance improvements or secure a budget for performance work, I found myself needing to convince others of its value. Admittedly, carrying the torch for performance can be exhausting, but the message starts to get through once you start putting things in familiar terms.
Organization-wide Product Vision
I’ve always admired organizations like Dotdash Meredith, which prominently feature the following statement across their site:
The best intent-driven content, the fastest sites, and the fewest ads.
I admired it so much that I brought this quote to my leadership team while working for one of Dotdash Meredith’s competitors. Speed can be a competitive advantage for a product, but having it as part of the product vision is rare. Compare that statement to the one below, and consider where performance might play a larger role in product decisions:
Our value-driven culture and unwavering focus on quality has evolved the company into a dynamic and growing digital media business that continues to inspire, teach, and connect.
I worked at the company who had the latter statement on their site and sometimes needed to dip into the bag of tricks to carve out time for performance work. Through trial and error, I realized that certain tactics were more effective for specific job roles.
Executive Support
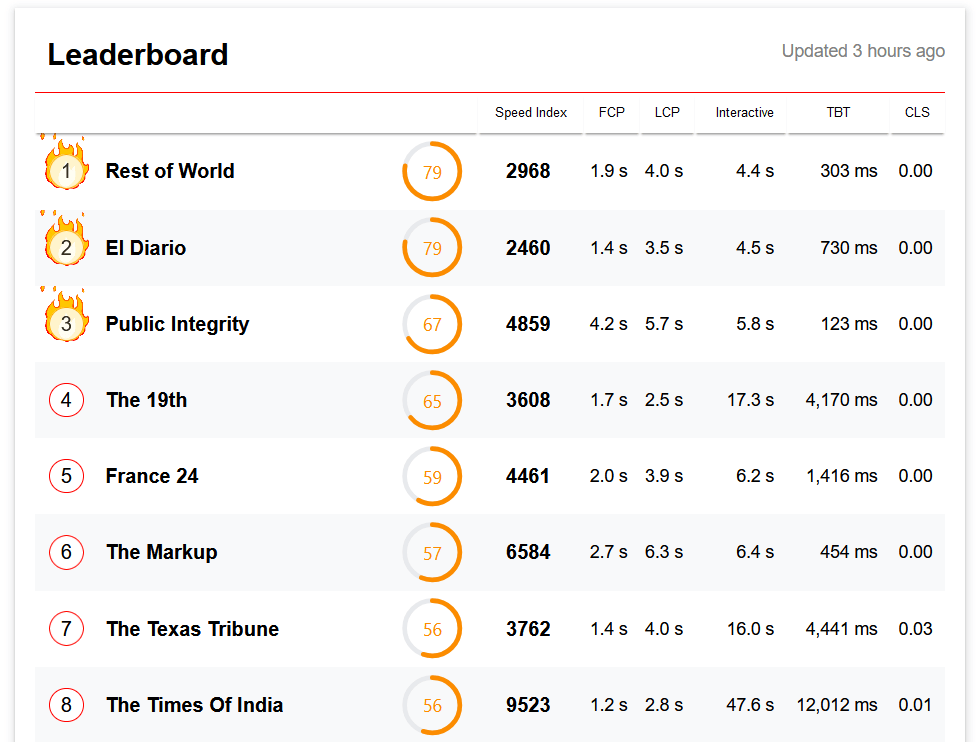
To garner more support for web performance work, I needed to convey information more meaningfully than simply talking about milliseconds. In my previous role, I asked the marketing department who our largest competitors were for each brand and produced my own version of the article leaderboard.

Through this exercise, I created an artifact that clearly showed where each of our brands stood relative to their competitors. Initially, all our properties were in the middle or toward the bottom of the rankings. I was emboldened to email the report to my CEO.
Since no CEO likes hearing that a competitor has a product advantage, I received a reply from my CEO saying the report was enlightening and asking if there was anything we could do quickly.
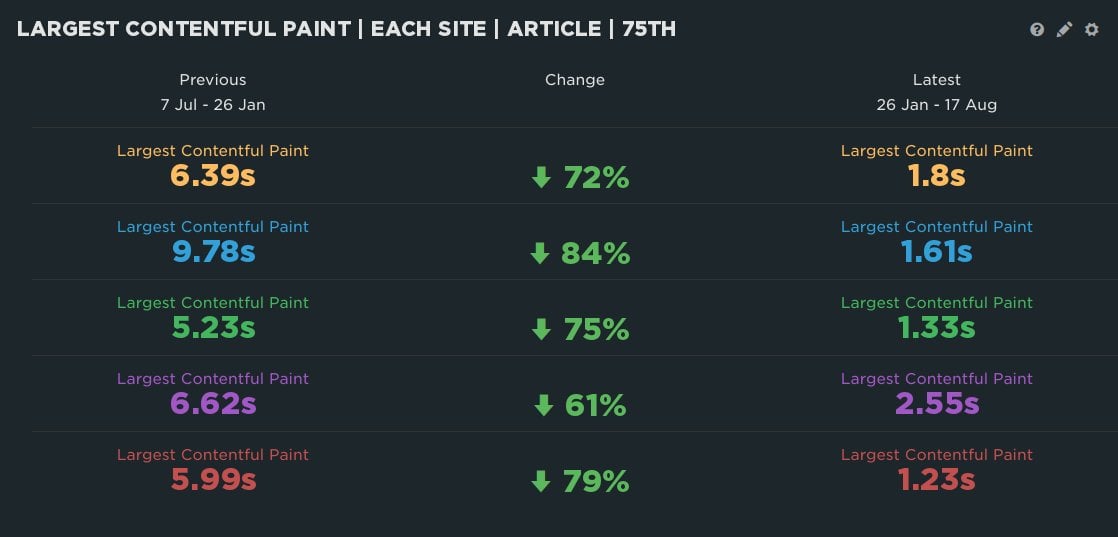
With the CEO’s interest secured, I focused on quick wins to rapidly demonstrate progress. These incremental improvements ultimately led to a much more impressive combined result:

This conversation took place in 2021, and by 2023, performance-related information started showing up in company updates and strategy decks.
Advertising Operations (Ad Ops)
If you work in media, there’s a high likelihood that ads generate a portion of your company’s revenue. The ad ops department is responsible for inventory, fulfillment, and reporting.
In my experience, ad ops often assumes that more inventory equates to more money. However, if you use a header bidding approach, a common method for programmatic advertising, the bidding process spawns hundreds of requests, trying to keep the bidding window open long enough to sell the inventory at the highest rate.
Performance testing revealed that excessive bidding activity and poorly performing marketplaces were creating network bottlenecks. Using the prebid.js analytics adapter, we tracked fulfillment data in Google Analytics to identify issues.
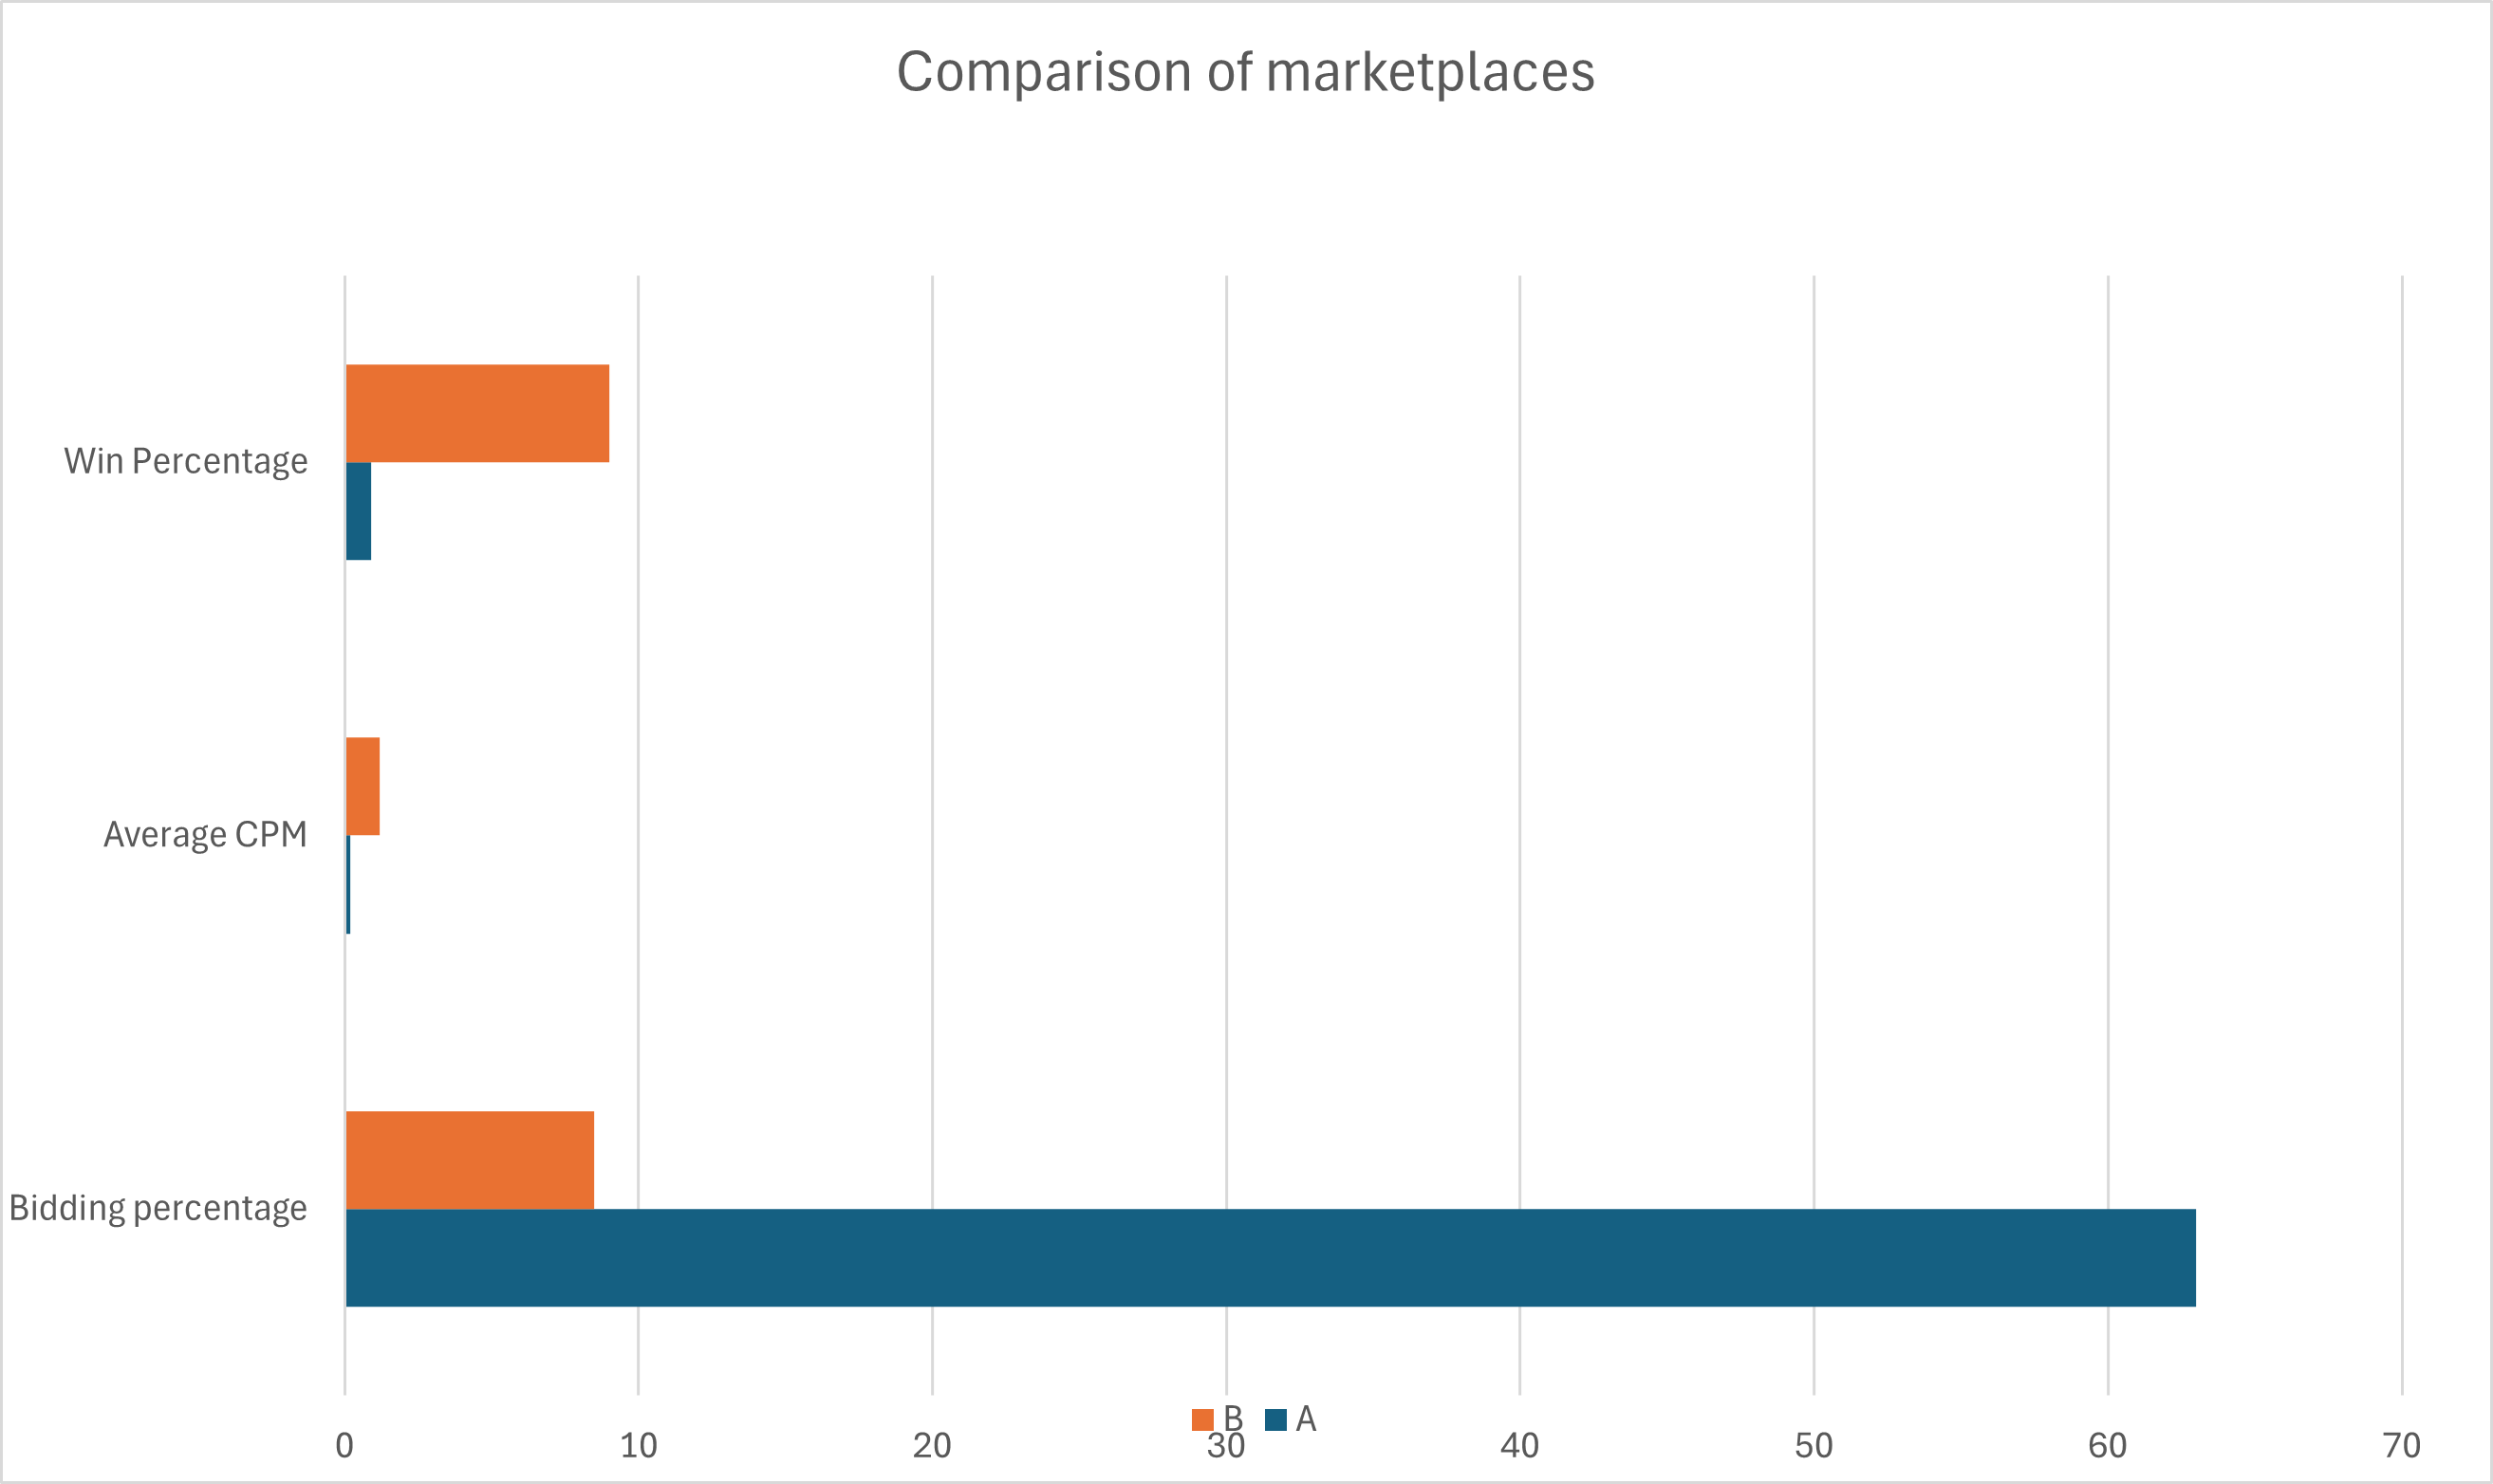
For instance, marketplace A bid on 63% of page requests, had an average CPM of $0.18, and won 0.9% of the time. In contrast, marketplace B bid on 8.5% of page requests, had an average CPM of $1.19, and won 6% of the time. Clearly, marketplace A wasn’t worth keeping around. I supported my explanation with an artifact like this:

Testing this hypothesis on a small percentage of traffic confirmed we could reduce partners without negatively impacting revenue. This success built trust for future collaborations with ad ops.
From a performance perspective, fewer ad requests meant that there was less competition for bandwidth and less activity happening on the main thread. Performance did improve, but the key was putting it in terms that ad ops cared about and not talking about the main thread or bandwidth at all.
The Marketing Department
Marketing relies on analytics to measure campaign efficacy. Many of these analytic script vendors claim they won’t slow down a site, but they still often impact users’ ability to interact with the UI, sometimes significantly.
Keep in mind, marketing teams often have the authority to select the tools they want to use, and they might not have a choice of who their developers are. They might feel more allegiance to their tool selection than they do to you as a partner. There is often a natural tension that arises because of the nature of this relationship and sometimes a lack of trust in what the other discipline is doing.
Here’s an illustration of that tension from this Reddit post.
Is it the 4 analytics tools, personalization tools, chatbot, forms library, heatmaps tool, and more that are the problem? Nah, it must be something the web team is doing!
There is a correlation between performance and conversions, but unless you know what the relationship is in your specific situation, case studies often aren’t enough because they leave the door open to objections like “we’re not [insert company name]” or “we’re not in [insert industry name].”
Auditing and Ownership
Start by auditing your site to identify all running scripts and periodically clean out your tag manager. This ensures every script has a purpose and that contracts are current. A process like Chip Cullen’s manual performance audit can be a helpful guide.
Once you know who owns the relationship, you can learn how the person, group, or team is using the tool. I’ve come across situations where there have been redundant tools, but marketing team 1 did not like marketing team 2 and was reluctant to share information or access to data. That’s a relatively easy thing to address because there’s usually a shared reporting structure, and it’s a point of escalation away from getting the right people involved.
In some cases, the data from these tools may be more valuable than the potential revenue boost from removing them. That’s a business decision, and the best you can probably hope for is to help provide people with information and let the chips fall where they may.
A/B Testing
A/B testing can reveal how new third parties or changes impact conversions. This is helpful because many of the disagreements about the merits of “yet another third party” are subjective or based on intuition, and A/B testing is a way to make the conversation objective by getting data about the impact of changes.
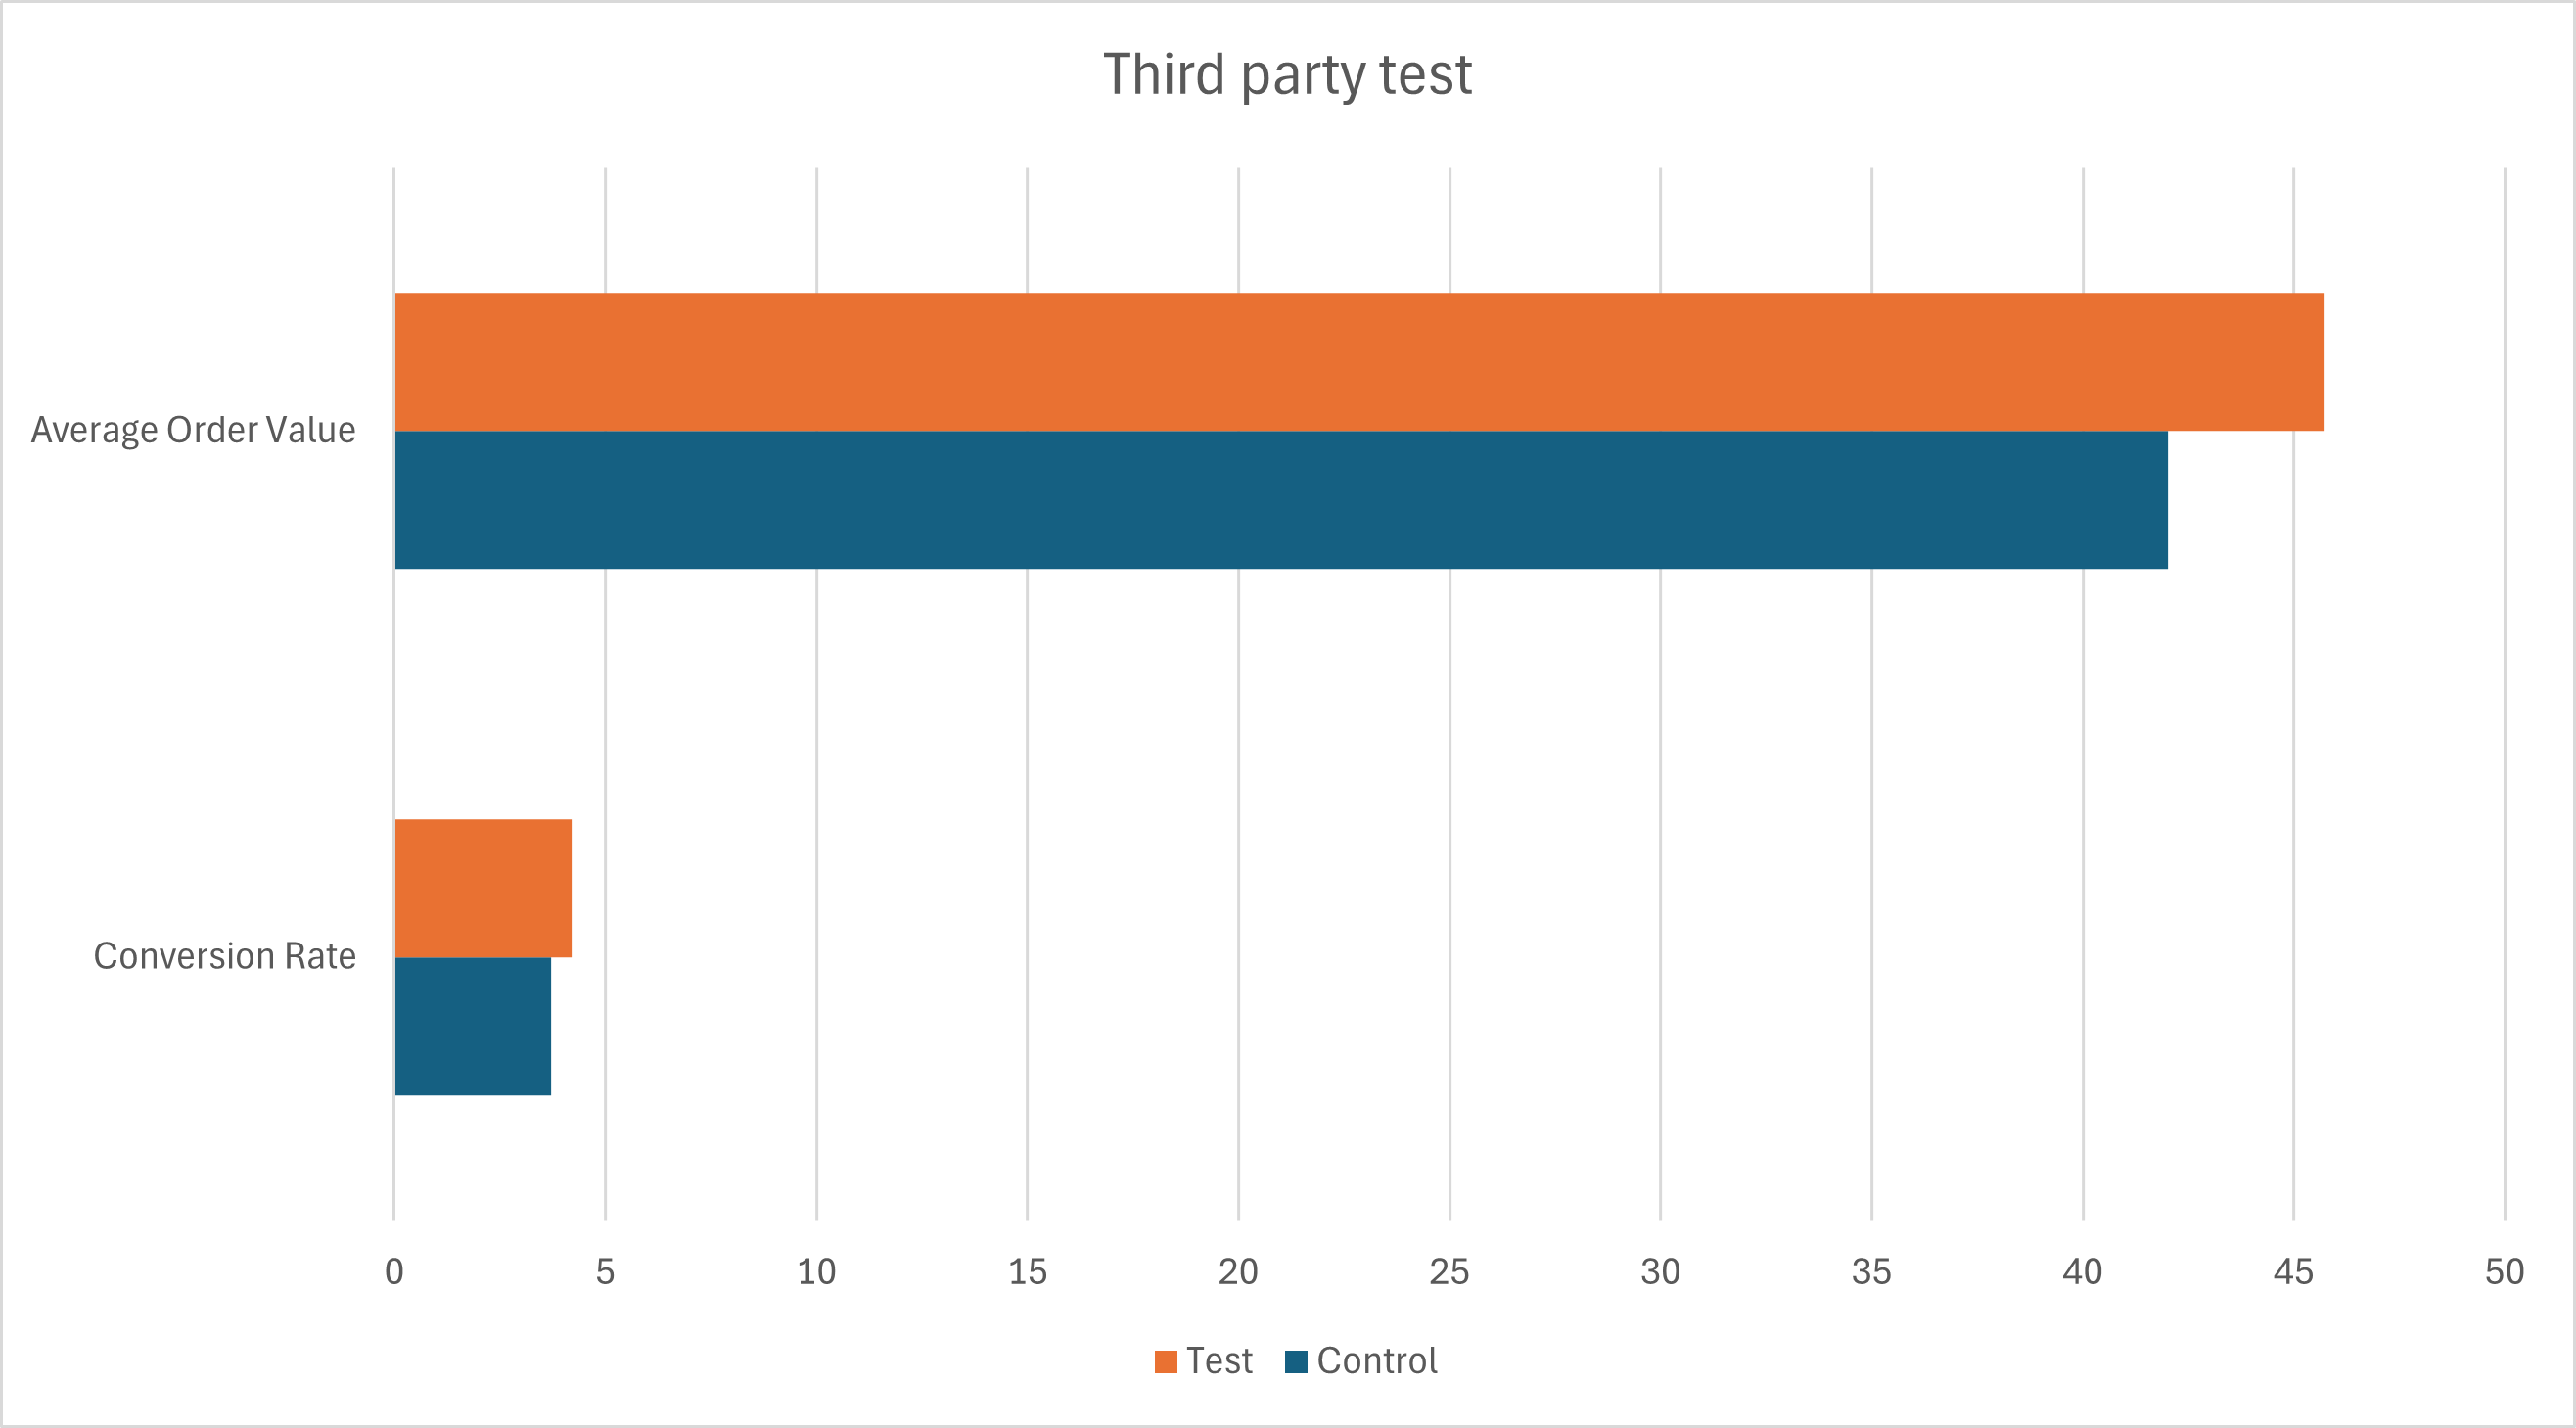
It’s important to go into an A/B test with the mindset of a researcher. You aren’t trying to win an argument. You are running an experiment to test a hypothesis. At the conclusion of the study, summarize the findings and use visual aids like graphs to communicate results effectively. For example:

In the test variant above, we removed a third party script, and the control variant was served with the third party. The experiment showed that the conversion rate and average order value were both higher in our test variant than they were in our control. Based on the amount of traffic you receive, this data can be translated into a dollar amount, and there can be conversations about whether the actions the marketing department will take with the data outweighs the cost of including the script.
If marketing decides to remove a tag, your users benefit, and it looks pretty good when they mention the bump in revenue that was uncovered by the A/B test. They might start seeking your expertise when there are other scripts they want to add.
A/A Testing
From time to time, there might be someone who questions the results of A/B tests and attributes any variance between the test and the control to external factors.
To preempt such objections, consider running periodic A/A testing, splitting traffic between identical experiences. If the conversion rates are similar between the two groups, that validates the testing system, which makes it much harder to argue with the results.
Conclusion
Relating performance information to each role is essential for illustrating the “why” behind web performance. Visual artifacts make information more digestible. While objections and challenges will arise, gaining allies and building a roster of advocates can significantly impact your success, and putting everything in familiar terms that are relevant to your audience helps build these relationships.
