
Look, I’m just going to come out and say it: I’m a jealous man. I’m not proud of it, but I’m a jealous man. These past months and years, I’ve seen great update after amazing update (not you) being released for the Chrome Devtools Performance panel while my personal favourite panel, the network one, has gotten a lot less love over time. Because I’m a jealous man, this makes me sad, and a bit angry; why can’t I have nice things?
Recently though, I’ve managed to pull myself out of this sulky phase, and decided I’m going to try and do more to “be the change I want to see in the world“. After some discussions at the recent perf.now() conference, I put together a list of devtools network panel features I’m missing in my day to day job of debugging and researching networking performance. I tearfully shared this with the Chromium devtools team to guilt-trip them into implementing some of my suggestions (or provide me some guidance on how to do it myself!), as it’s nearly Christmas after all.
However, I recognize that most of the devs developing devtools might not be as deep in the woods about all this networking stuff as I am; they might not immediately understand WHY I so desperately desire human contact these features. Similarly, I expect a lot of you reading this also wouldn’t easily grasp (or care about) these low-level intricacies, because you’re mostly focused on frontend performance and often treat the network as an unknowable black box filled with weird three/four letter acronyms and dragons.
As such, I decided to write this article, which will explain the reasons behind some of my more important feature requests. To try and help both the devtools developers and the frontend freaks understand the more complex issues I encounter when looking at network performance, how it can go wrong, why it matters, and hopefully also show how you can apply some of these learnings in your own optimization workflow. Take a deep breath, and let’s go 🤿
1. Allow per-request slowdowns
Let’s start with an easy one. It would be great if you could delay the response (“Time To First Byte”) for each specific request (or, dare I hope, all requests to a specific domain) by a configurable amount of milliseconds.
This allows us to simulate what would happen if a particular resource is slow to come in-for example because there was a cache miss at the CDN, because the origin was slow in SSRing it, or because a 3rd party is misbehaving. This is important especially for render/parser blocking CSS and JS, as those can have cascading impacts on everything that happens after them-for example LCP, but also loading of other resources that are dynamically referenced in them (say with @import, url() or fetch()).
This is distinct from network throttling as a whole, since that delays everything by the same amount, while this allows us to cherry-pick things to simulate/discover a “single point of failure”. For example, many people still don’t realise that a single render blocking 3rd party JS in the <head> can mean that your site remains empty for several seconds if the 3rd party has an outage (as the browser waits for a timeout). Paul Calvano recently released a new tool to help detect this type of potential issue.

<head>. The first is tagged as defer, so does not block the parser. The second one however (jquery) is loaded synchronously, and will block parsing until it is fully loaded! If code.jquery.com goes down, this site will appear to be down as well!For various performance testing/simulation tasks we can make do with the excellent slowfil.es. This site does something similar, but requires using dummy resources on their domain, which leads to other artefacts and requires changing the HTML. As such, it would be better to have this implemented in the devtools directly.
Importantly, it’s not just me asking this! There was an “idea board” for devtools at perf.now() with this as a post-it, and it had a lot of sticker buttons from people indicating they wanted this feature! (I should have taken a picture, because now no-one will believe me…)
2. Show why requests are queued and stalled
The networking panel has a convenient “Timing” tab/popup that shows a breakdown of where time was spent when loading a resource. It details for example how long the connection setup and the resource download took; these kind of speak for themselves. It however also has entries for “queueing” and “stalling” of requests; here it’s often much more difficult to understand what that means exactly.
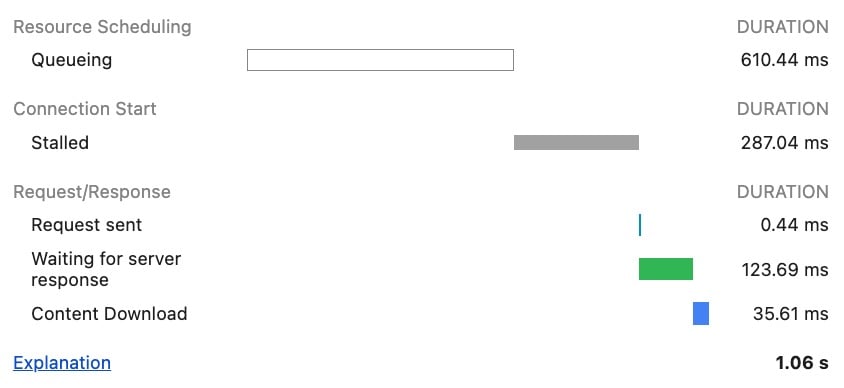
This is because there is no indication of WHY the requests were queued or stalled, just that they were. It’s unclear whether it is due to internal browser processes/overhead (which the developer probably can’t fix) or whether it is because of an inefficiency in the way the page is built/the deployment works (which the developer might be able to influence!)
Even the documentation of these timing entries (the “explanation” link in the screenshot) isn’t very clear on exactly what might be the root cause for q-ing/stalling in the first place. They only list the following vague possible reasons:
- There are higher priority requests.
- There are already six TCP connections open for this origin, which is the limit. Applies to HTTP/1.0 and HTTP/1.1 only.
- The browser is briefly allocating space in the disk cache.
However, there are several other potential reasons I can think of:
- The connection setup is not done yet. On HTTP/2 and /3, a single connection is re-used for many resources. The connection setup timing info is only shown for the first resource on that connection though… other resources just say “queueing” while the connection is being established (see image below)
- Tight mode is active. Browsers intentionally delay lower priority resources at the start of the page load to deal with misbehaving servers. This reason is conceptually the same as saying “there are higher priority requests” but arguably more correct (since after tight mode, priority order matters less/becomes “waiting for server response”) and more actionable, with the fetchpriority API or preload (I don’t want to explain tight mode here, as I did a recent talk on it that explains it in all its gory detail, if you want to have trouble sleeping tonight)
- Limited by flow control. Modern protocols like HTTP/2 and QUIC have advanced flow control options, which might limit how many requests can be active at the same time/how much data can be outstanding.
- Many other potential reasons that aren’t documented. For example, I’m not sure if slow Service Worker cache lookups show up as kjueueing/stalled or something else here, but I assume they would/should? Maybe CORS preflight requests could/should be called out here explicitly as well? etc. Several more are listed in this old issue on the subject.
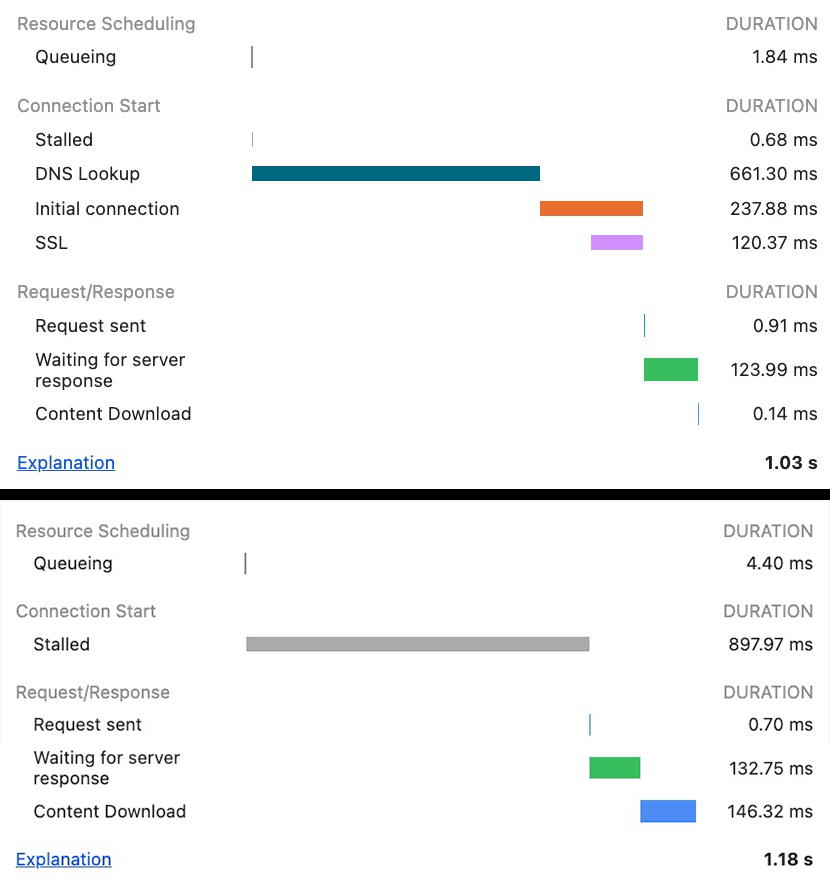
The end result is that on several occasions, I’ve had customers complaining about long cuing or stalling overheads, claiming they were due to our server-side at the Akamai CDN. It is difficult to explain to them that this is in fact (usually) due to browser logic and normal page loading processes/protocol behaviour. Having clear indicators in the devtools would go a long way towards easing that tension (though not having words like queueing in the English language would remove even more tension).
3. Show when chunks arrive in the waterfall
The current devtools waterfall view is quite coarse in the different phases it shows. While the connection setup does split between DNS/TCP+TLS/QUIC, after that there’s basically just two colors/parts: A) “waiting for server response” (green) (basically this is Time To First Byte, TTFB) and B) Content download (blue) (Time to Last Byte, TTLB):
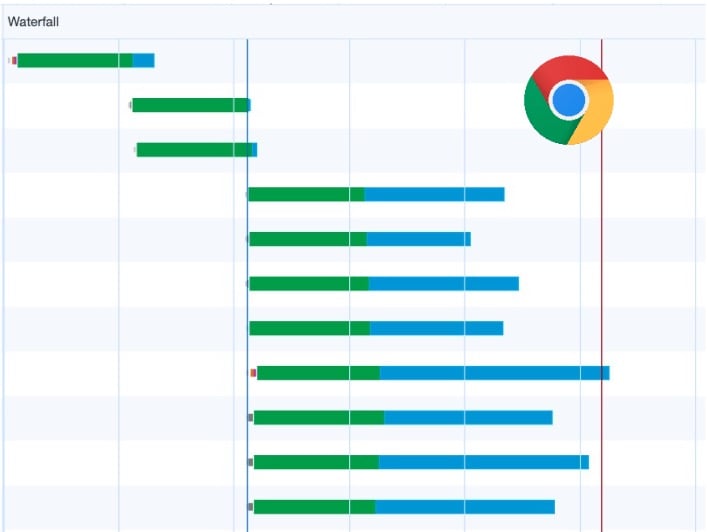
Conceptually again, this is fine: in practice you usually only care about when the resource is fully downloaded and how long that total process takes. However, this approach can easily give the wrong impression of what actually happens on the wire. For example, the above image might make you think that all those resources are being downloaded in parallel, all sending a constant stream of bytes on the wire. However, especially on HTTP/2 and HTTP/3, this is rarely the case. The newer protocols rather “multiplex” resources on a single connection, distributing the available bandwidth among them in various ways. This can lead to radically different ways of actually receiving data, as you can see in the next image:
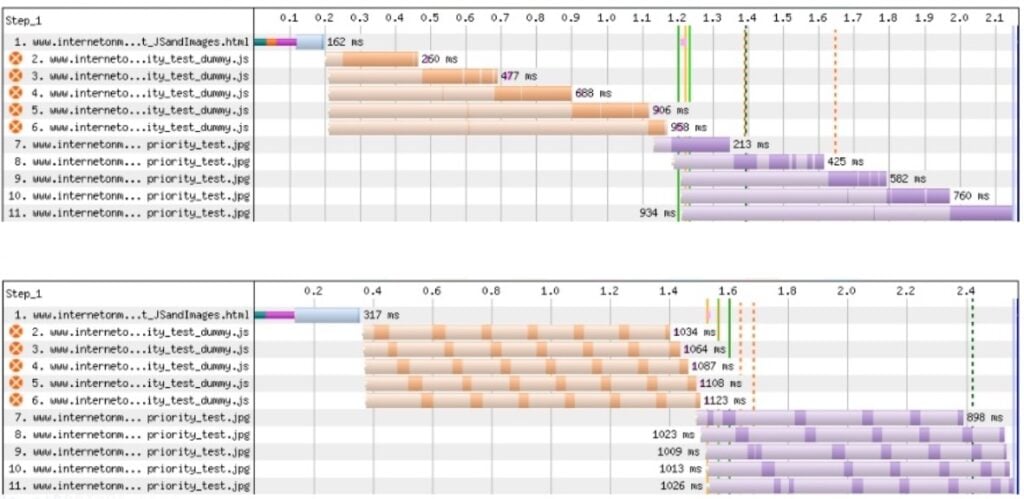
The WebPageTest waterfall above explicitly shows when data is actually being received for a specific resource. It doesn’t use a single color between TTFB and TTLB like Chrome, but rather uses two shades: a lighter shade when no data is being received, and a darker shade when data is actually coming in.
This makes it immediately obvious that there’s a big difference in behaviour between the two server implementations in the screenshot, while in the Chrome waterfall these would look much more alike (though, to be honest, a trained eye could still use some educated guesswork to deduce what’s probably happening).
It is often important to be able to see this low-level behaviour, because even today many servers still make mistakes in how they distribute bandwidth across resources in HTTP/2 and HTTP/3. For various complex reasons (which, again, I have a conference talk about this), this can negatively impact Web performance. However, many people are simply not aware that these issues exist because they’re not obvious in Chrome’s waterfall. If this would be changed to show when chunks come in, we could train people what type of pattern to look for (for example, JS and CSS should really be loaded sequentially) and it would quickly be obvious when a server gets it wrong. Ideally, we’d also see the actual timings of when the TCP/QUIC packets arrived on the wire, rather than when the data was read by the browser renderer process (as these can be quite different in practice…), but I’m willing to compromise 😉
While we can get this from other tools like WebPageTest (and to an extent DebugBear), these are again not tools everyone is comfortable using, and might not be trusted as much as the browser’s built-in tools.
(Note: I intentionally kept this section short not to bog down the overall post, but there is SO MUCH MORE to say about this… it was even a major part of my PhD (while the PhD was a major part of my current mental state)! So if you’re interested in more details, feel free to reach out).
4. Show DNS resolution details
Currently, we get almost no information from the Domain Name System (DNS) resolution step; it’s basically just the total time it took, and the final IP address the browser ended up connecting to. Now, you might think: so what? What more do you want Robin? Isn’t that all DNS does?
But oh my sweet summer child, there’s so much more to DNS nowadays that I would like to know the details of. Firstly, some deployments use DNS for load balancing, so a query might return more than 1 viable IP address the browser might use. When debugging said load balancing setup, it’s VERY useful to see which IPs were returned and which the browser ended up choosing (and why).
Secondly, there’s more and more people supporting IPv6 nowadays (finally!), often in tandem with IPv4. For DNS, this means clients typically do two separate queries: an “A” query for IPv4 and an “AAAA” query for IPv6 (yes yes, the v6 query has 4 As, typical off-by-2 error). If the browser gets a reply to both, it needs to decide which of both IPs to use for the actual connection. This decision is governed by an algorithm called “Happy Eyeballs” (yes, seriously), which uses a bunch of different heuristics (and often several parallel connection attempts where one option gets a small head start) to finally decide which IP to use. Getting insight into which DNS responses the browser received and when, and which Happy Eyeballs steps it used to finally decide on the “winner” would be mighty useful, especially since IPv6 can be much faster in some countries/locations, but not in others.
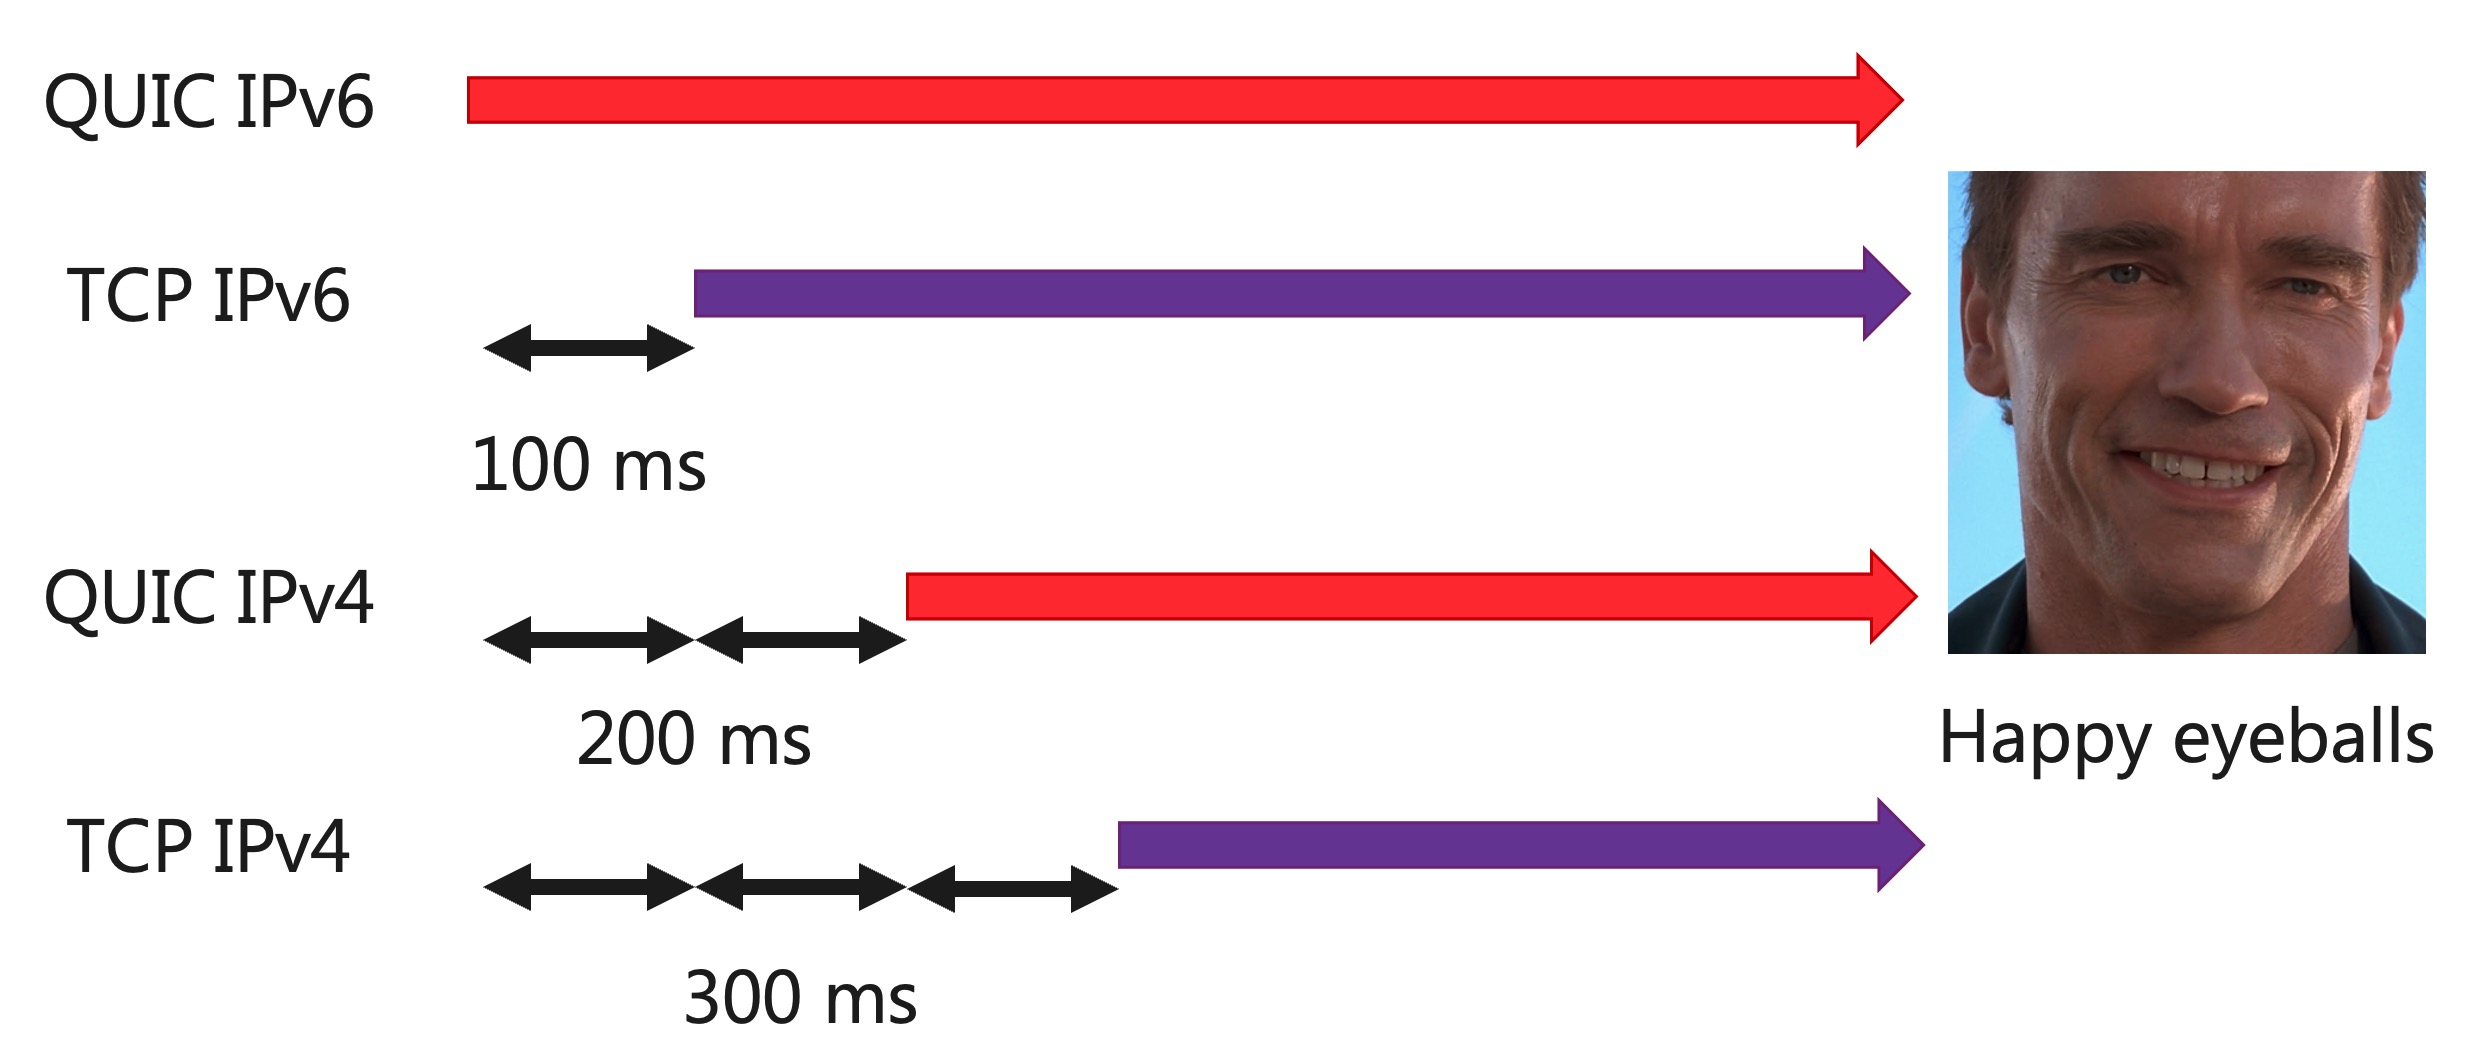
Thirdly, DNS is used for more than just IP resolution. The relatively recent DNS “HTTPS” records for example allow you to indicate which application protocols are supported by the server. This means the DNS itself would tell you if a server supported HTTP/3 or not, instead of having to discover that from the server with a separate lookup, removing some of the overhead of the so-called “alt-svc” setup. Being able to see the contents of a DNS HTTPS record response (if it exists!) would be highly beneficial, especially since the Happy Eyeballs mechanism also decides whether an HTTP/2 or HTTP/3 connection ends up being used towards the server. I’ve been screaming for this recently, as I’m trying to setup/test these new HTTPS records but having trouble getting the browser to actually follow their contents. Is there an issue with the record content? Is the browser simply ignoring it? Does it just come in too late? Does HTTP/3 get abandoned for another reason? I can get more useful answers out of my toddler than the browser. While I personally might be able to go deeper with tools like Wireshark and netlog, most of my customers cannot; and sadly, DNS issues can be very localized 🙁
Fourthly, the new “Encrypted Client Hello” (ECH) TLS feature helps improve privacy by encrypting the “server name indication” (SNI) field in the TLS handshake, so network eavesdroppers can’t see which site you’re trying to connect to. And, you guessed it: ECH works by distributing pre-shared encryption keys via those new DNS HTTPS records 🙂
Fifthly, there are also initiatives to improve the privacy (and security) of DNS queries themselves, by querying DNS over TLS (DoT), over QUIC (DoQ), or (and no, I’m not kidding) over HTTPS (DoH). I hope it’s obvious how complex those things can be to properly debug and configure, and not having easy visibility into how the browser does this is severely hindering those efforts (even more so than not having a functional DoH server over at www.homersimpson.com).
I could keep going, but I think I’ve made my point that it would be very beneficial to have easy access to DNS-related information in the networking panel. In this case, I’m not asking for complex new UIs or flowcharts or separate waterfalls or… just a simple textual overview of DNS information received (and maybe a summary of actions taken based on that) say in a separate details tab, would already do so so much.
5. Show TLS handshake details
Similar to DNS above, information on the TLS handshake and its negotiated parameters is very scarce in the browsers’ devtools. While for webperf use cases TLS is arguably slightly less complex than DNS (fewer moving parts that can impact performance) and while browsers do allow showing TLS certificate content details in the URL bar, it would still be useful to be able to inspect some low-level details of the handshake itself. A big part of this is seeing the employed TLS extensions and their values, as they can have a big impact on how the encrypted connection is used in practice.
Some examples of metadata I would like to inspect are:
- The TLS version used: TLS 1.3’s handshake uses 1 less round trip on the network than TLS 1.2, which can have an important performance impact.
- The size of the TLS certificate in bytes and if it was compressed: especially for HTTP/3, large TLS certificates (several kilobytes) can end up triggering its “amplification prevention” limit. This causes an additional round trip to be taken for the handshake, undoing its benefit over TLS 1.2.
- The offered Application Layer Protocol Negotiation (ALPN) values: these determine which version of HTTP (and other protocols!) the browser is allowed to use.
- The used QUIC transport parameters: The QUIC protocol (which underpins HTTP/3) uses TLS to send some of its transport level metadata, which includes a bunch of performance-related settings, such as how many concurrent streams can be open at the same time, and how much data can be sent on a connection. Issues with these types of settings have been known to cause long-running performance cliffs.
By far the most important information I crave however, is on TLS’ “session resumption” and “early data” features. In the protocol, you have the concept of “sessions” that can be paused (user leaves a site) and later resumed (user visits the same site again within X hours). If you resume an earlier session, you have less handshake overhead, as the browser and server can re-use some settings from last time (for example, you no longer have to send the full server certificate)!
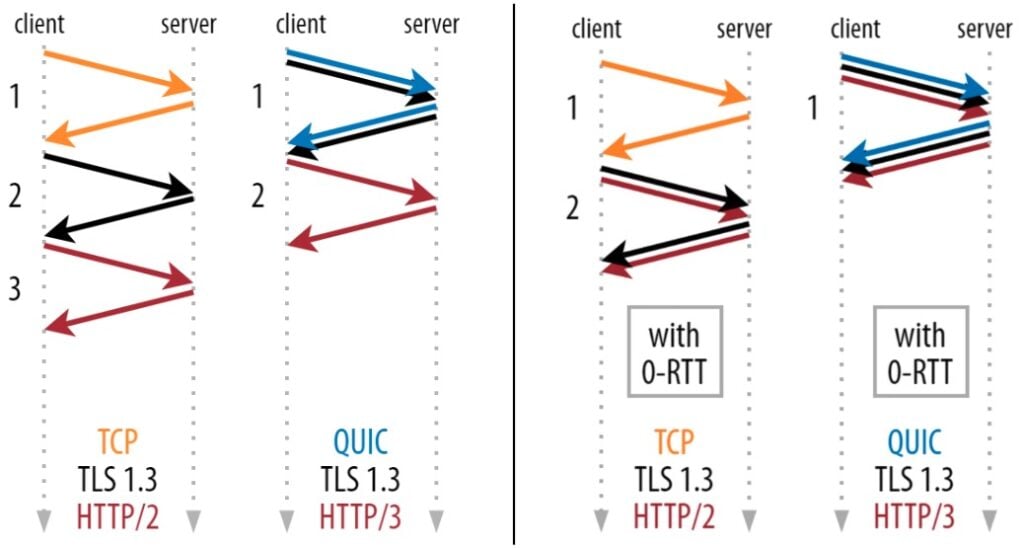
Additionally, when resuming a session, some deployments allow you to use “early data” (sometimes also called 0-RTT). This means the browser can send the first HTTP request of the session (typically for an HTML page or an API request) in parallel with the TLS handshake instead of after it completes, which means HTTP response data can start coming in a full round trip earlier. To do this in a secure way, it encrypts that first request with encryption keys derived from the previous connection.
And that is where it all tends to start spinning out of control quite fast… Firstly, session resumption and early data rely on the server providing so-called “session tickets” to the client. These tickets have a limited lifetime (typically expire within 24 hours) and might not be re-usable in some situations. Secondly, the tickets limit requests to “a maximum amount of early data”, which might be too low for a certain use case. Thirdly, 0-RTT data has some important security considerations, such as the possibility of replay attacks, that servers have to protect against. For all these reasons (and more), the server might decide not to accept an Early Data request from the client, or it might not even offer usable session tickets. Similarly, clients might decide not to use the session tickets, even if they’re still valid.
All of this leads to an exceptionally difficult to debug mess in practice (ask me how I know…), as it’s often not even clear if the client had received valid session tickets in the first place. Even if it had, it’s uncertain if it actually sent a HTTP request in Early Data or not, and if the server rejects it, we’re left wondering why exactly.
Again, conceptually a power user can use other tools to do basic debugging, but client support for 0-RTT data outside of browsers-especially for HTTP/3-is quite terrible at this moment (even cURL has only very recently started adding this), and even then the used heuristics will be different from the browsers. Netlog and Wireshark are again not something I would (or could) recommend to a typical user here, even if they’re a developer.
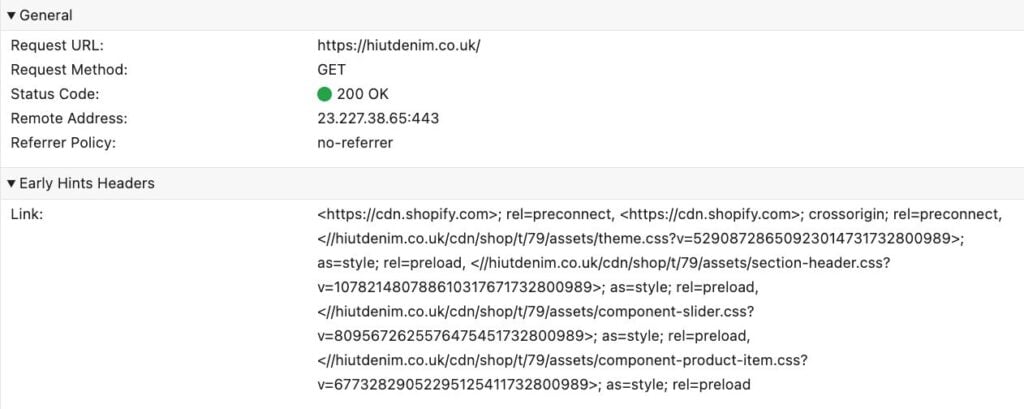
For this one, I would already be happy if we could even add just one simple thing: an indication whether Early Data (0-RTT) was used or not, and if yes: which URL was requested. This would at least already give some feedback and a place to start looking. We even have a recent example of what this could look like in the devtools from the similar (and highly complementary) 103 Early Hints! That feature allows the server to send back some HTTP response headers before the final response is done (kind of like “early data from the server side”). The networking panel also doesn’t really show all the inner details of this, but just surfaces which Early Hints were received as a special section in the Headers tab (see below), which is plenty useful in practice. Even something simple like that for 0-RTT would be exceptionally appreciated!
6. Show how connections are used
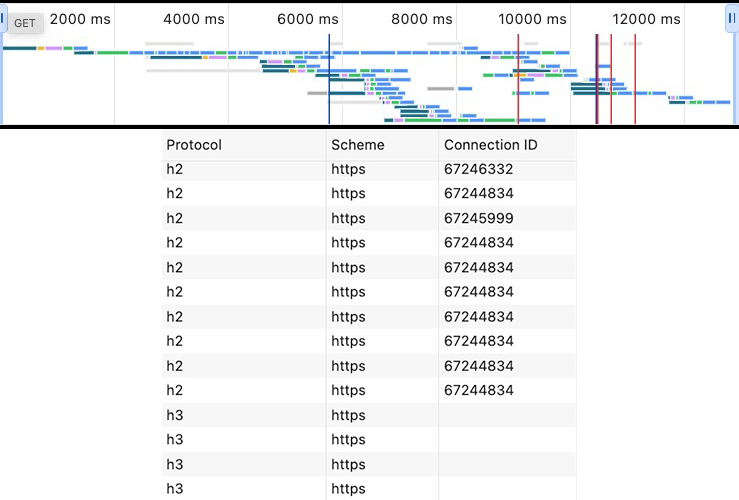
When loading a page, often many different HTTP connections are used at the same time. When debugging network-level performance, it’s of course important to know which connections are used to download which resources, something that can be difficult to figure out from the network panel. While there are some advanced features to help with that, they’re not super useful: the high-level “overview” (top of the image) is very zoomed out and doesn’t really show how connections are actually used, while the “Connection ID” column is often not filled in for HTTP/3 and HTTP/1.1 (bottom of the image).
In addition to good insights on opened and used connections, we also need info on connections that were abandoned or not opened in the first place, which can happen in several situations:
- Connection coalescing/reuse: This feature allows browsers to reuse an existing connection instead of opening a new one, even to other domains: as long as the two domains (a.com and b.com) share the same TLS certificate, the browser can (and often does) re-use an existing connection to a.com to fetch b.com/main.js. This is often quite unintuitive to users and can cause misinterpretations. For example, HTTP/3 might not be used for b.com even though it’s enabled, because the browser is re-using an existing HTTP/2 connection to a.com instead.
- Happy Eyeballs: As discussed above in the DNS section, browsers often tentatively open several connections in parallel and then choose one “winner”. It would be good to see some details on the “losing” connections to understand why they lost.
- Alt-svc usage: Browsers typically will only try to setup an HTTP/3 connection once the server has first explicitly announced support using the “alt-svc” response header over HTTP/2 or HTTP/1.1. The browser maintains a separate alt-svc cache for this purpose, with separate “time to lives” for each entry. There’s currently no way to view the contents of this cache or to clear it. Additionally, if the browser does attempt HTTP/3 but it fails for some reason, it might employ an “exponential backoff” delay before it even tries HTTP/3 again. It’s near impossible to identify if this is happening (and why) or to reset that delay manually.
- Protocol switching: Sometimes, browsers will opportunistically switch from HTTP/2 to HTTP/3 even during an ongoing pageload, abandoning the old HTTP/2 connection for a newer HTTP/3 setup.
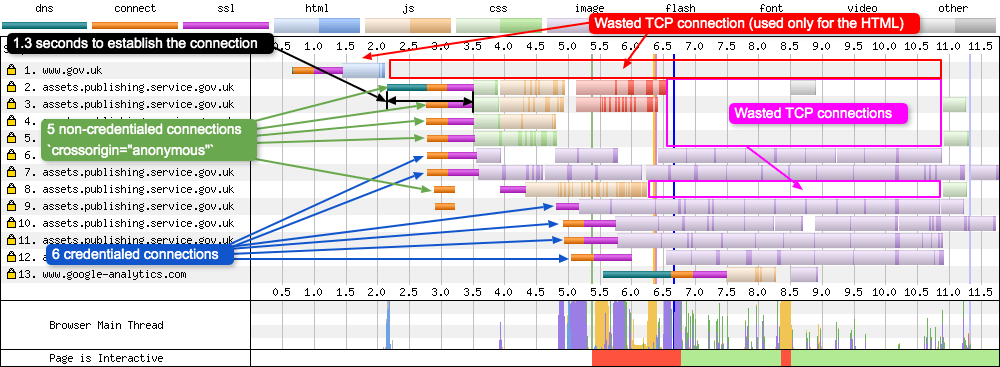
- CORS/crossorigin connections: Due to CORS issues the browser sometimes needs to establish two separate connections to the same domain (kind of the opposite of connection coalescing imo, oh the irony). This often catches people out, causing them to for example forget the
crossoriginattribute on preload and preconnect resource hints, leading to useless connections to be setup, and the browser having to scramble to open a new connection to actually download the resource.
The problem with all this is that, unlike for the other features described in this article, I don’t really have a very good idea of how to properly integrate this into the network panel myself… I think at the very least we should have something similar to WebPageTest’s “Connection View” (see image below), which looks and functions a bit like the existing “overview minimap” but provides far more actionable detail (especially with the different colors for different resource types). However, that still wouldn’t give details on the various “abondoned connections” I mentioned above, nor would it be easy to integrate into the UI of the existing panel. Maybe something new is needed here? Maybe several things? Maybe we should standardise browser .HAR files and make them more powerful and importable in WebPageTest? (only half kidding here peeps)
One final related thing I would like to ask for is the ability to forcibly close all open connections for a given page/domain. By default, the browser keeps connections open for several seconds or even minutes, even when closing all tabs for a given site. This makes sense for normal browsing, but when you’re testing network-level stuff and are actively tweaking server-side configurations, this can get annoying. This is especially the case when testing features that only happen at the start of a new connections, such as DNS resolution, Happy Eyeballs, HTTP/2 vs HTTP/3, TLS Early Data/0-RTT, and 103 Early Hints. Currently, I can work around this somewhat by testing in a separate browser profile / incognito mode and always closing that down completely before testing again, but that’s somewhat annoying if you want to keep previous results around in other tabs and it’s again not clear if that has an impact on things like Early Data (e.g., if session tickets survive closing of incognito mode).
7. Allow custom parsing of header values
As you might have heard, you can now extensively customise the devtools performance panel by adding custom entries and even fully custom tracks, directly from JavaScript! Combined with the ability to annotate the traces, this makes for a very powerful tool to analyse highly specialised issues in your own stack, and then discuss them with your colleagues and customers! Wouldn’t that type of thing also be cool for the networking panel?
More specifically, a lot of server-side deployments use custom HTTP response headers to communicate some debug information to the client to make analysis easier. For example, my employer Akamai has a bunch of response headers you can trigger. X-Cache can let you know if something was found in the edge server cache with a TCP_HIT or TCP_MISS value, while X-Akamai-Request-ID gives you the unique ID for a request which can be used to trace it across our internal network for deeper analysis. Other CDNs use very similar setups.
However, the header values are often quite obtuse and difficult to parse manually, as they tend to use code numbers and abbreviations instead of full sentences/complete JSON objects, and concatenate a bunch of related things together. This is mostly done to save some bytes on the wire, but can make interpreting the values more difficult, especially for customers that aren’t used to parsing the values:
Let’s look at some examples from Akamai and Cloudflare in the image above. While the URL portion of the X-Cache-Key-Extended-Internal-Use-Only (what did I say about saving bytes again?) is somewhat obvious, many of the other things are not. As an Akamai employee for example, I know that the /000/ part means that this page cannot be cached at the edge (cached for 0 seconds) and that this would be something like /3d/ if the resource could be cached for 3 days. The rest however? I always have to look that up. Similarly, I understand what TRAIL_FOR_CLIENT means (and that it probably should be trial instead of trail?) and I live near Brussels, and the a= value looks like an IP; but other than that no clue (X-Akamai-Transformed is equally allergic to clarity). In a similar vein, Cloudflare recently started adding some very cool low-level information in their Server-Timing headers. To me, almost everything in there makes sense and I know how to interpret it, but to non-protocol-nerds? Do you know what a cwnd is? Or the cid? Or what the normal/expected values are of those fields?
Arguably, most people shouldn’t have to interpret these values and/or should be able to copy-paste them into an external tool that does the translation for them. However, I think it would be cool if we would at least have the option to also do that translation/explanation directly in the devtools UI. Currently, you can of course build a custom extension that adds a completely new panel to the devtools to provide this type of translation/extra information (in fact, Akamai does exactly that for some of its products), but that does not integrate well with existing functionality and would often end up duplicating it.
Ideally instead, the browser would provide some APIs (similar to what’s now possible for the performance panel) to hook into the rendering of the header values. This way, we could drastically improve UX not just for employees and customers of these big server deployments (yes, ok, it’s me, it would drastically improve UX for me, happy now?) but potentially also for the wider community. Because admit it: you probably also encode some stuff as base64 in your cookies, right? Or you have some weirdly formatted GET/POST parameters for your fancy APIs? Or you return 200 OK for all REST API calls and reflect the REAL 404 status code in X-real-status-code (or even worse, in the JSON body, you monster!). Indeed, we can imagine this going further than just customisation of the header values, also allowing people to hook into the rendering of JSON API response previews, to add server-timing markers in the “Timing” tab, or even add completely new tabs. The world would be our oyster 🦪.
While the performance panel extensibility is triggered via JS on the loaded page, I personally think network panel extensibility should also be doable via a browser extension, as it’s unlikely (though far from impossible) that an intermediary like a CDN server would add custom JS to every page just to provide this type of enhancement. So, devtoolians: getHTTPHeaderRepresentation(name, value) when?
8. Small but useful UI changes
In this last section, I’m going to cheat a little bit, by adding together a bunch of smaller feature requests that mostly impact the UI and that should be (relatively?) easy to implement (famous last words), but that would give massive quality-of-dev improvements. In no particular order:
- Add individual timings as columns: have DNS resolution, connection time, TLS time, TTFB, download time, etc. all as separate columns. This makes it easy to take screenshots with all salient information in one place (without the Timing tab popover obscuring a bunch of things)
- Have an option to use WebPageTest colours for individual resource types: in the Chrome devtools waterfall, every resource is green and blue… why not add some carnivál by also allowing a separate colour per resource type, which works really well in WebPageTest to quickly get an idea of what type of resource is most prevalent/giving issues.
- Have the option to sort the waterfall differently: currently it sorts on when a request was actually made, not when the resource was discovered in the HTML, which makes it annoying to debug certain scheduling issues.
- Stop calling it SSL: It’s been TLS for over 20 years now, it’s old enough to vote!
Ok I lied, there is a particular order, because this final one is actually super-duper-important and should be added ASAP:
- Show important loading modifiers/info directly in the UI: Right now, there is a big disconnect between the network panel and other panels/metrics. For example, it’s impossible to see which image was selected as the LCP element. It’s unclear if a JS file was marked as async/defer. Similar aspects like
loading=lazy,crossorigin, orpreloadgenerally have to be deduced by manually going to the source view/inspector panel and correlating stuff based on URL, which is not great. Confirming if something was considered render blocking is nigh impossible even then. I’m putting so much emphasis on this, because there’s actually a tool (DebugBear) that adds all this metadata as extra markers in their waterfall, and it’s the bee’s knees:
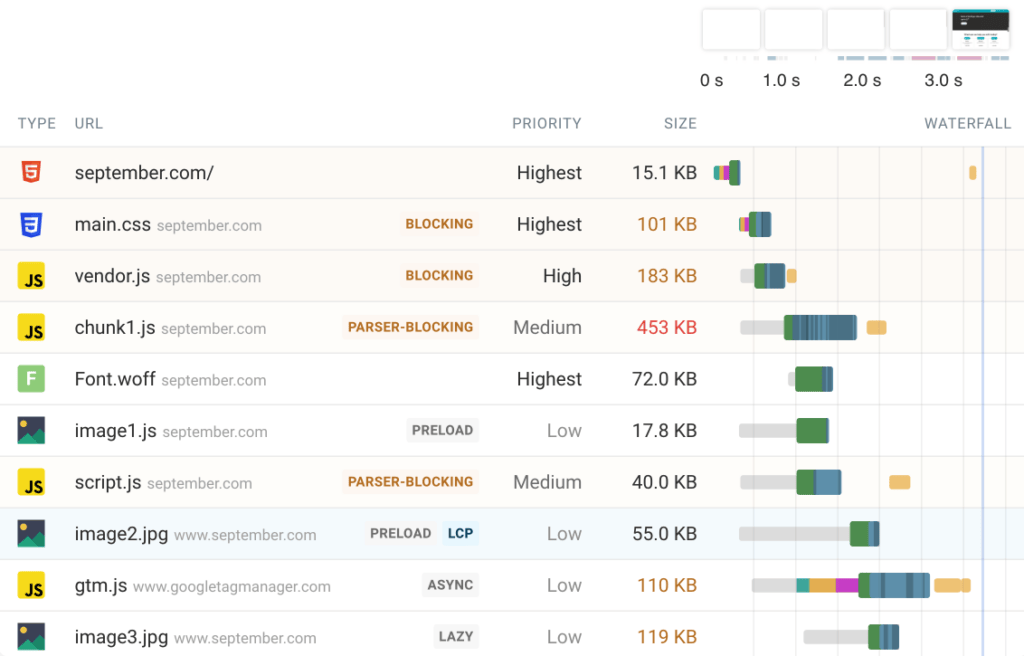
I think that adding these types of markers shouldn’t be too difficult to implement, and I KNOW they would make a bunch of typical use cases easier and faster (because nowadays I always reach for a DebugBear trace first whenever I do some perf analysis). In fact, out of all the things I’ve talked about in this blog post, I would rank this one as the highest priority to get implemented (as they say: save the best for last 😉).
Conclusion
You’ve made it this far; have a cookie 🍪!
Overall, I think I’ve made a solid case that the “network panel” actually hides an awfully large amount of what happens on said network. Arguably that’s a good thing: it helps us focus on what’s most often the problem. However, it does also prevent us from noticing (and then fixing) some long standing issues (such as bad HTTP/2 and HTTP/3 prioritization) and properly experimenting with new features (such as 0-RTT). As such, I feel it should be improved.
As a counterpoint, you could say that 99% of people shouldn’t have to/don’t care about these issues and that people like me should just use other, more specialized tools (like netlog and wireshark). And I do think that’s somewhat fair. However, I could easily make that very same argument about some of the recent changes in the performance panel… I would argue that most devs shouldn’t have to look at JavaScript profiler flamecharts to get decent performance, let alone get so deep into the woods they need to start sending each other annotated traces. And if they do, wouldn’t that also be better solved with external tools? And yet, those arguably similarly expert-focused use cases are pandered to quite extensively inside the browser. I’m willing to bet money that badly used preloads cause more waiting time for actual end users than long CSS selectors ever will, but guess which one has custom-made devtools? Of course I don’t want to sow discord here and pretend like the performance panel doesn’t solve real problems; ideally, we’d just have tools for all of these things, as this should not be an “either-or” but an “and-and” situation. I just think the emphasis has been put a bit too much on one side of the aisle (and, as I said, I’m a jealous man).
Another important aside is that this is of course not just Chrome/Chromium; I just picked that because it’s what I use most of the time and what I feel most devs/readers are most familiar with. In fact, most (all?) of what I’ve said above also goes for the network panels in Firefox/Gecko and Safari/WebKit. In my opinion, their network panels are in many ways severely behind Chrome’s in basic features and UX (which is the main reason I use Chrome in the first place). If any developers of those engines are reading along: I’m perfectly willing to discuss this with you as well, of course, but I feel Chrome has the fastest path to big improvements here (either through implementations from the team, or by contributions from the community).
As such, I hope this will lead to at least some of my suggestions, hopes and dreams to come true in a future version of the Browsers’ devtools! However, this should not just be about my personal feelings, but about our hopes and our dreams; I can certainly imagine that you, dear reader, have some other network-related features you might want to see added to the devtools, or have some better ideas than me on how to improve things in practice! If that’s the case, feel free to add your suggestions, thoughts and feedback to the document, which is open to all for commenting! Even if you don’t have anything new to add but just want to confirm a specific feature would also be of great help to you, all feedback is welcome!
Finally, my conscience does force me to make it clear that network performance usually isn’t the lowest hanging #webperf fruit you might find on your pages. Most of you should still start with the frontend stuff, and I hear they have some excellent tools that can help you with that 😉. But, once you start to get serious about squeezing every last millisecond out of our wonderful World Wide Web, I’ll see you down at the-hopefully soon to be significantly improved-network panel. 👋


Thank you for such an informative article. This is the best article of 2024. No kidding!
Great insights! Looking forward to more posts like this. we are provide Troubleshoot Internet Issues with My-ToolsKit Tools. Visit Example