Tsvetan Stoychev (@ceckoslab) is a Web Performance enthusiast, creator of the open source Real User Monitoring tool Basic RUM, street artist and a Senior Software Engineer at Akamai.
TL;DR:
In this article I am sharing the good news that Web Performance Optimization is being studied in universities and I am laying out the plan of teaching Real User Monitoring which I will do for the first time in front of students. My hope is to share ideas in case other fellows would be doing something similar in the future and at the same time I am looking for feedback and ideas.
Yep! True story!
The Salzburg University of Applied Sciences offers a Web Performance Optimization course as part of the Web Engineering specialisation.
Do you know of any other universities that offer such a course? I would be happy to hear more.
Earlier this year I learned about the course from Brigitte Jellinek who happened to be organizing it and teaching part of the course. While chatting on the topic, Brigitte mentioned that she is gathering a task force of experts/guest lecturers that would deep dive on different web performance topics. I happened to know some stuff and we discussed the possibility where I could be a guest lecturer on the topic of Real User Monitoring. Well it’s happening and in January 2025 I will meet the students and we will explore RUM together. Let’s RUM-RUM-RUM 🙂
It was a nice surprise to hear that we are partnering with 2 familiar names:
- Fabian Krumbholz – covers Google Core Web Vitals
- Keerthana Krishnan – covers Optimization Techniques
What about the course audience?
I was pleasantly surprised to meet Brigitte and a few of the students at Performance.now() 2024 edition. They were really bright, enthusiastic and curious. The course is part of a masters program and what I learned was that some of them already work as web developers and others are transitioning to web development. The fact that they attended Performance.now() says a lot and they are definitely looking forward to upskill.
The conference photographer caught us talking about web performance and RUM.

Original photo by Richard Theemling – https://perfnow.nl/2024/photos?p=314
The course plan
I will be sharing knowledge about RUM (Real User Monitoring) and the various applications of RUM in the world of Web Performance.
I would like to share some theoretical and practical knowledge. On the theoretical part we definitely will talk about percentiles, histograms, rum data sample size and so on. On the practical side we will play with different RUM systems and each student will have their own playground in the form of a WordPress website that will contain pages with different web performance challenges.
I won’t be sharing the complete RUM part of the course in this article but I would like to share what will be the key learnings.
But before I dive in, special thanks to DebugBear, Treo, Catchpoint and SpeedCurve for providing trial versions of their systems for the practical part of this course.
Key learnings
RUM vs. Synthetic
It’s well known that a single Synthetic Lighthouse or WebPageTest test run will give us an indication about a performance problem but it won’t show us how often a website visitor experiences performance issues.
It’s possible that with a synthetic test we could miss to test a page that is critical for the visitors’ journey.
With RUM we have the possibility to collect performance and business metrics from every page that’s being visited.
I wrote the “possibility” above. Why is that?
I could think of bunch of possibilities where RUM could have blind spots:
- The visitors use Tracker/Ad blocker which blocks the RUM tools from collecting and sending data.
- The webmaster decided to enable sampling and to monitor just part of the visits.
- A browser family doesn’t expose performance metrics to the Browser. For example we know that in 2024 Safari still doesn’t provide an API that would allow us to read the Core Web Vitals metrics – CLS, LCP and INP. There are options like the performance-event-timing-polyfill by Uxify but of course a native browser support will be ideal.
- The website visitors didn’t allow it to be tracked for web performance analyses purposes by a Cookie Consent Popup.
But where does Synthetic shine?
A Synthetic test won’t tell us much about the user experience/perceived performance but it will provide us control over simulating slow CPU, network conditions, screen size, operating system and so on.
In a Synthetic test results we will be able to look in depth at CPU utilization, bandwidth, main thread activity and long tasks.

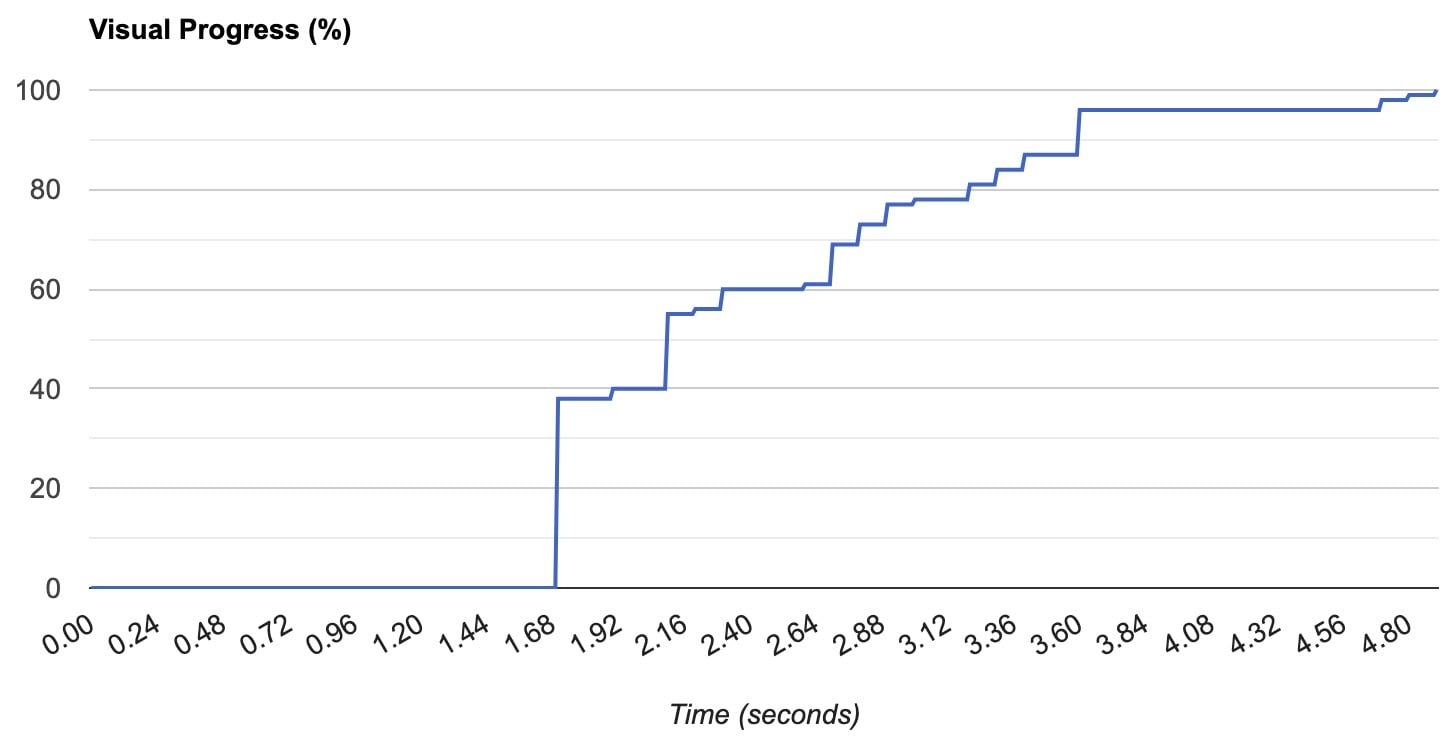
Visual progress.

It’s fair to say that in RUM context with the help of PerformanceLongTaskTiming and Long Animation Frames browser APIs we can get visibility about long tasks and what kept the Main Thread busy but we still won’t have the level of details that a synthetic tool provides. Also these 2 APIs are supported only for Chromium based browsers but not available in FireFox and Safari.
It’s important to mention that some of the limitations in collecting RUM data are intentional and exist due to security and data privacy considerations.
Data Collection in the browser
An important question about RUM is:
How do we read performance data from the Browser and how do we send/beacon the data to our own server?
We definitely will touch on this topic together with the students and will explore the NavigationTiming data structure and the PerformanceObserver API .
For example we will look at the NavigationTiming timestamps and will calculate DNS, Connect, Redirect … times:
var navigationTiming = window.performance.timing;

console.log(JSON.stringify(navigationTiming, null, 4));

{
 "connectStart": 1735409198838,
 "secureConnectionStart": 1735409199031,
 "unloadEventEnd": 1735409199626,
 "domainLookupStart": 1735409198838,
 "domainLookupEnd": 1735409198838,
 "responseStart": 1735409199619,
 "connectEnd": 1735409199234,
 "responseEnd": 1735409199623,
 "requestStart": 1735409199235,
 "domLoading": 1735409199627,
 "redirectStart": 0,
 "loadEventEnd": 1735409199669,
 "domComplete": 1735409199669,
 "navigationStart": 1735409198835,
 "loadEventStart": 1735409199669,
 "domContentLoadedEventEnd": 1735409199654,
 "unloadEventStart": 1735409199626,
 "redirectEnd": 0,
 "domInteractive": 1735409199653,
 "fetchStart": 1735409198837,
 "domContentLoadedEventStart": 1735409199654
}
Demo bunch of RUM systems
Together we will be enabling and instrumenting different RUM solutions. Our main exercises will be on DebugBear but we will play with some of the other popular RUM systems.
A few other systems we will playing with:
The idea is for the students to gain hands-on experience on different systems which will help them to understand the differences and eventually decide to choose the right system for their next project.
Free tools
Of course we won’t miss to mention the free tools out there that are great enablers for experienced engineers and newcomers:
- CrUX Dashboard by Google
- CrUX Vis by Google
- Free Site Speed Test – by Treo
- Free Site Speed Tools – by DebugBear
- UX Score Checker – by RUMvision
- Free Website Speed Test – by Speetals
Instrumentation
In order to start collecting RUM data, a special JavaScrip snippet must be included in the HTML of a website. This snippet is typically provided by the RUM provider. We will practice adding snippets by different RUM providers.
Some of the RUM providers expose JavaScrip APIs that allow us to add our own metrics, timers and dimensions. Together we will be exploring and creating our own JavaScript that interacts with these APIs.
Gap in the data
Not all browsers support the same set of metrics. We already touched on the fact that Safari still doesn’t support CLS, LCP and INP but of course there is more. LCP was added to FireFox at the beginning of 2024 but CLS and INP are not supported yet. The Chromium based browsers have the richest set of metrics which leads to a gap in the data and a lot of doubt when we look at how other browsers are performing.
The community of course works on filling the gap and there was a recent announcement about INP polyfill by Ivailo Hristov from uxify.
Check out the great post in 2024 Web Performance Calendar about the polyfill:
- Towards Measuring INP on All Browsers and Devices – https://calendar.perfplanet.com/2024/towards-measuring-inp-on-all-browsers-and-devices/
However, the message to the students will be that polyfills are helpful but should not be considered as permanent solutions … the native browser support works best.
Observing metrics over time
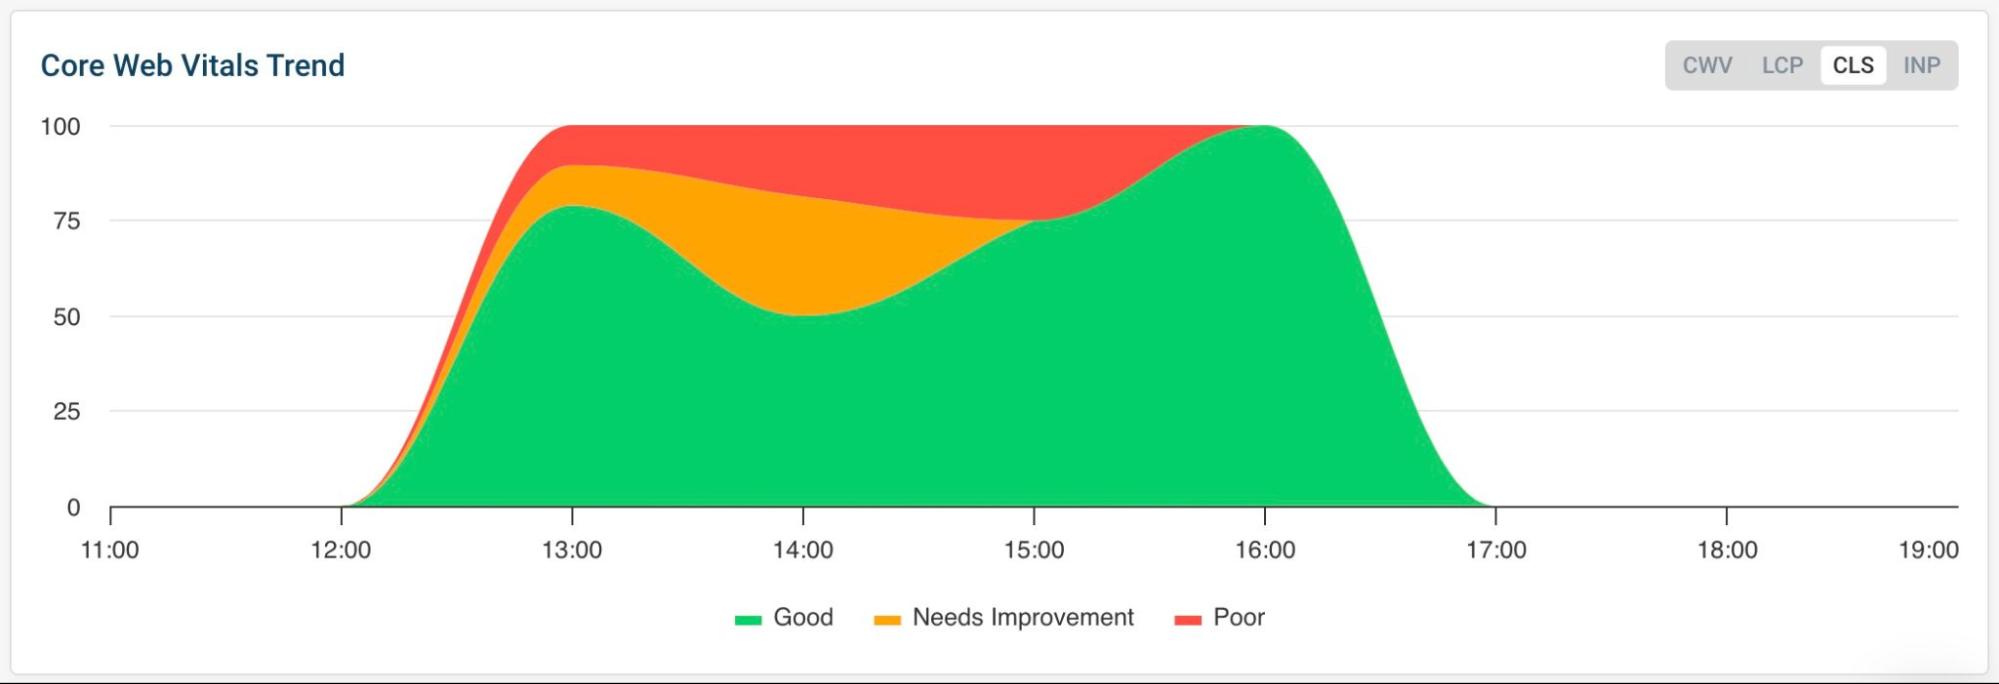
Each student will have its own playground that will contain various performance challenges. The key learning here will be to build comfort around, to learn to read time series data and to easily spot an improvement or regression like in the example below.

The sample size
I am not a statistician but one thing I learned when I first started working in the web performance field was that the sample size matters when making any guesses while looking at RUM data.
The course is part of a Master’s Degree and it’s possible that some of the students haven’t had heavy math/statistics classes during their Bachelor studies. That’s why I would like to demonstrate how a few outliers in a small sample size could lead to the wrong conclusion.
To demonstrate this best, let’s look at 2 situations where we monitored LCP with a RUM tool.
| # | Collected 10 times | Collected 1000 times |
|---|---|---|
| 1 | 3.30 sec | 3.30 sec |
| 2 | 4.60 sec | 4.60 sec |
| 3 | 2.80 sec | 2.80 sec |
| 4 | 8.20 sec | 8.20 sec |
| 5 | 1.20 sec | 1.20 sec |
| 6 | 8.50 sec | 8.50 sec |
| 7 | 8.20 sec | 8.20 sec |
| 8 | 8.50 sec | 8.50 sec |
| 9 | 1.10 sec | 1.10 sec |
| 10 | 8.50 sec | 8.50 sec |
| 11 | — | 0.4 sec |
| … | — | … |
| … | — | … |
| 996 | — | 1.3 sec |
| 997 | — | 2.3 sec |
| 998 | — | 1.8 sec |
| 999 | — | 1.5 sec |
| 1000 | — | 1.4 sec |
| — | — | — |
| P 75 | 8.4 sec | 1.6 sec |
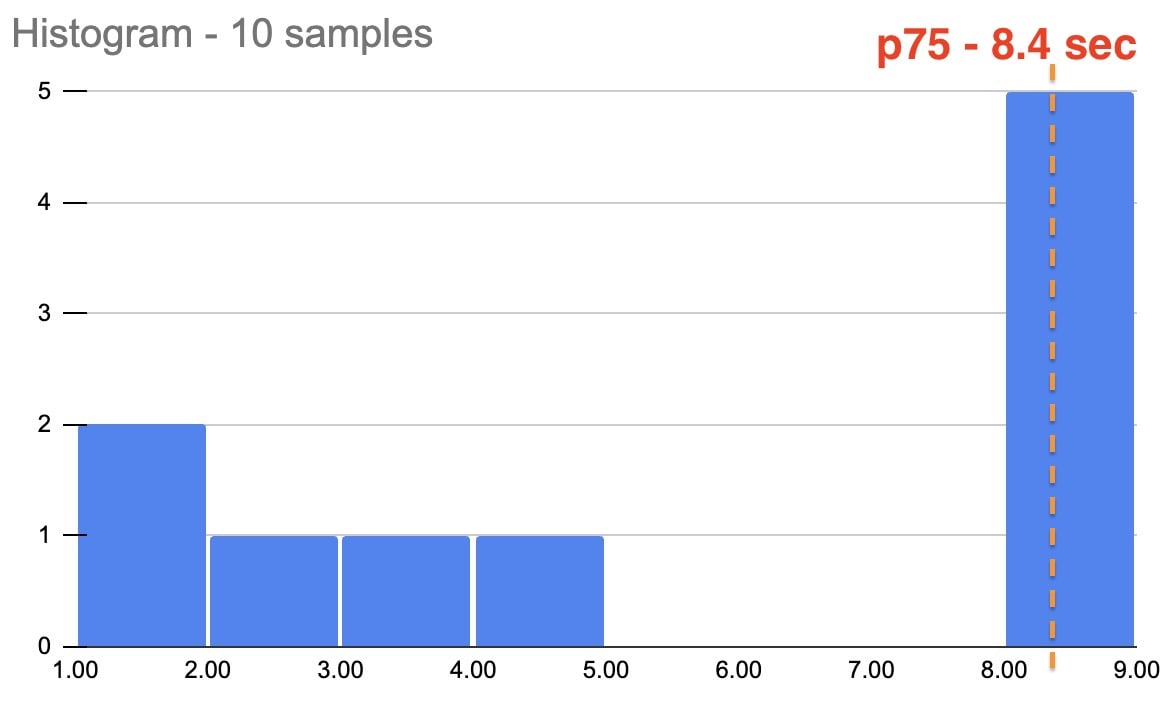
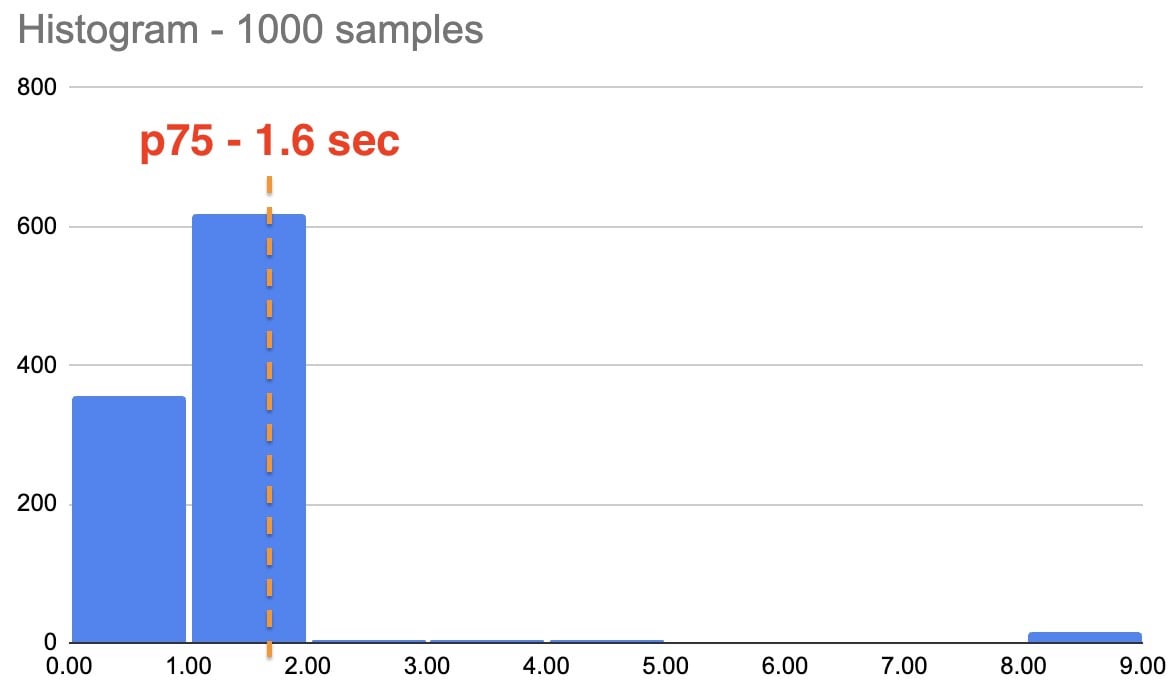
We notice that the first 10 samples are the same in both cases but we got 8.4 sec for the the 75th percentile when we looked at 10 samples but we got 1.6 sec for the the 75th percentile when we looked at 1 000 samples.
Let’s confirm this visually.
We notice how a few samples that are near 8 sec pushed the 75th percentile to 8.4 sec.

When we look at a larger sample size we still notice the few samples that are near 8 sec but they are considered outliers because most of the samples are between 1-2 sec.

A few articles worth glancing over:
- Why you’re probably reading your performance measurement results wrong (but at least you’re in good company) – https://calendar.perfplanet.com/2011/good-company/
- Statistical significance – https://en.wikipedia.org/wiki/Statistical_significance
PII data
PII stands for personally identifiable information and we must avoid collecting such data in case of collecting RUM data for web performance analyses.
For example I’ve witnessed a few times PII data being accidentally exposed as part of query parameters like in the following example:
I would like to bring awareness about PII as part of this course. We also will discuss strategies about what to do in order to avoid collecting PII data and what to do in case we accidentally collected PII data.
A really good write up about PII by the Matomo team:
- Personally identifiable information guide: a list of PII examples – https://matomo.org/personally-identifiable-information-guide-list-of-pii-examples/
In summary
I am still polishing the plan for the RUM part of the course. Still considering where it makes sense to deep dive and what information will be of great value for the students. I feel confident that I am touching on the important parts of RUM but I will be happy to hear ideas and suggestions.
Web Performance Optimization is not just a niche – it’s now making its way into formal education and I am happy to be part of it.

[…] 详情参考 […]
Do you have a spam issue on this site; I also am a blogger and I was wanting to know your situation; many of us have developed some nice procedures and we are looking to swap solutions with other folks please shoot me an e-mail if interested. Black car near me
Welcome to Punta Cana Taxi – private transfer punta cana airport the simplest way to get from Punta Cana International Airport PUJ to your hotel or resort. If you arrive at PUJ and wonder how much is taxi from Punta Cana airport to hotel we offer transparent fixed fares and courteous drivers so you can start your trip stress-free. Our team provides private transfers shared options and family-friendly vehicles so guests know exactly what to expect from airport taxi Punta Cana and regional transfers across the Dominican Republic.