

Martin Michálek is a web performance consultant and the co-founder of a small consultancy company focused on optimizing web performance for clients of all sizes, PageSpeed.ONE. With years of experience in front-end development and UI design, Martin helps businesses create faster, more accessible, and more user-friendly websites.
Despite its critical importance to online business, web performance is still fighting for attention from key stakeholders. Abstract technical metrics are not enough; people want to see money and the actual influence on revenue.
For this, we use data or case studies. But are we really as good at presenting numbers as we think we are?
The goal of this guide is to show you what you must look for in every study to avoid being misled and to obtain truly valid data for persuading your clients.
Don’t Let Poor Evidence Ruin the Perception of Website Speed
Concrete numbers from a real project are the best argument to show the direct impact of speed on revenue, conversions, or shopping cart abandonment rates. However, a truly valid case study with demonstrable business impact on a specific website is both time-consuming and financially expensive.

Persuading with case studies? Let’s do it better.
That’s why we all reach for publicly known case studies. The problem is that even a good case study comes at a cost. This high price is often the reason why the market is flooded with “quick case studies”—studies that confuse correlation with causality, contain incomplete data, or fail to filter out influences other than speed.
And this is the greatest risk: every flawed case study undermines the credibility of the entire web performance industry.
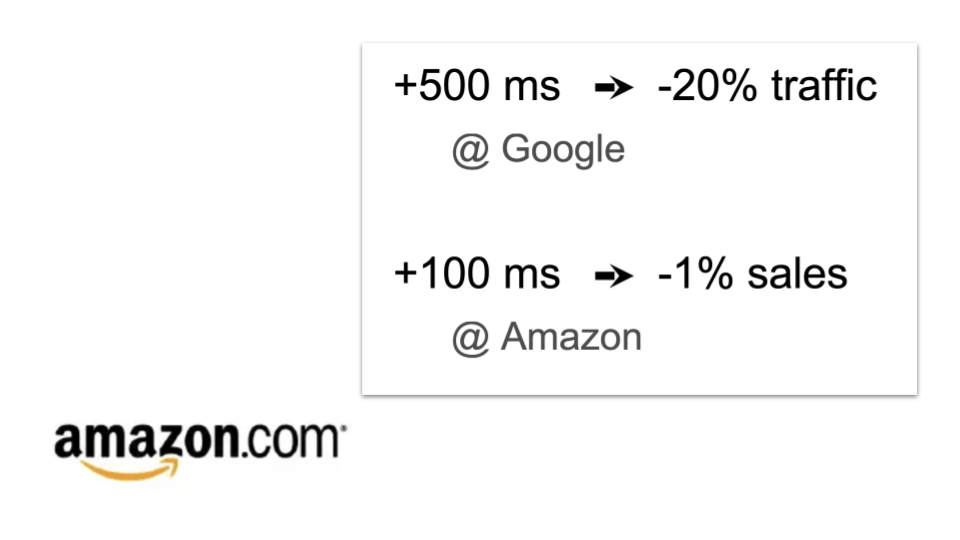
Bad Example: Amazon and 100ms = 1% Revenue Lift as a Historical Meme
Let’s start with the famous Amazon data about the 1% revenue loss for every 100ms of delay. It is one of the most frequently cited, but also one of the worst-substantiated studies in the field.
The statistic originated from Amazon’s internal A/B tests conducted around 2006. It was first publicly mentioned by former Amazon software engineer Greg Linden on his blog. The original PDF source is also preserved.
Let’s stop referencing this case study.
Linden stated that they deliberately delayed page loading in 100ms increments and found that even very small delays led to a drop in revenue. So, it was experimental causality—so far, so good.
However… The problem is not primarily the methodology (it was an A/B test), but the lack of data, and, crucially, the context and generalization that has accumulated over time:
- Data Age
The data is extremely old (nearly 20 years). The web, user behavior, connection speeds, and Amazon itself have radically changed since then. - Missing Data
We only know the number (1% revenue for 100ms), but not the underlying documents, data, sample size, or test duration. The result could never be critically assessed. - Generalization
The results applied to a specific domain (Amazon.com), a specific segment (e-commerce), and a specific user base at the time. Generalizing this data study to any website (B2B, blog, SaaS) is flawed and misleading, yet it is commonly done. - The Slide Myth
Due to its spread on a single slide, the statistic became a dogma without the need to state methodological details (e.g., statistical significance, duration, precise sample).
This famous Amazon “study” is now more of a historical meme and a perfect example of how a lack of context and the continuous repetition of old data undermine the credibility of the entire field.
Another Bad Example: Rossignol and its 94% Conversion Rate Improvement (Causality Killed by Confounding Variables)
Studies that report huge conversion increases often look appealing but hide a methodological problem: simultaneous changes.
We ourselves at PageSpeed.ONE used to cite this case study to convince our clients of the importance of speed optimization. It was a mistake.
I once showed this case study in a large Central European e-commerce company. There was silence, and then one person asked, “Do you really believe that?”
The sports brand Rossignol reduced its load time and achieved a 94% increase in conversion rate (CR). This is how the lure sounds.
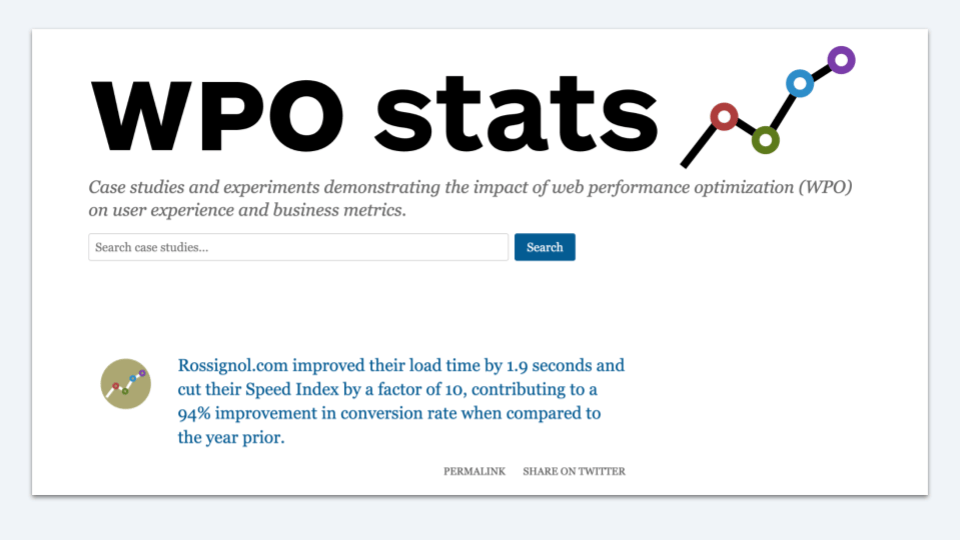
By the way, the original case study on Fasterize.com no longer exists, which is perhaps a good thing (Web Archive)
What was the problem with this case study? This increase was part of a complex digital transformation and redesign. Sources explicitly state that speed was optimized, but a redesign (a change in appearance and behavior of elements) was also performed simultaneously.
However, the original article lacks any substantiation—such as an isolated A/B test (fast version vs. slow version on the same design)—and it is also unclear what proportion of the profit was due to speed alone and what was due to the redesign.
Are you looking for more bad examples of quick case studies focused on technical indicators and misleading about business impact? Unfortunately, you can find many of them even on Google’s web.dev website. Google does a great job promoting speed as a topic, showing technical finesse, but the documentation of the business impact is rarely built on irrefutable data.
What About Good Examples?
There are also plenty of good examples. I am a fan of the work of Ron Kohavi, who does a great deal for the verifiable evaluation of website speed’s impact on business.
Yes, he is the father of modern A/B testing in big tech. The person who came up with a study conducted on Bing.com, which showed that every 100ms acceleration increased revenue by 0.6% (Source in PDF). This, too, is often cited but unnecessarily generalized.
In his new case study, he shows that improving the TTI (Time To Interactive) metric on the Talabat website from 2.1s to 1s improved revenue by 0.3%. Small? Yes, but it is verifiable.
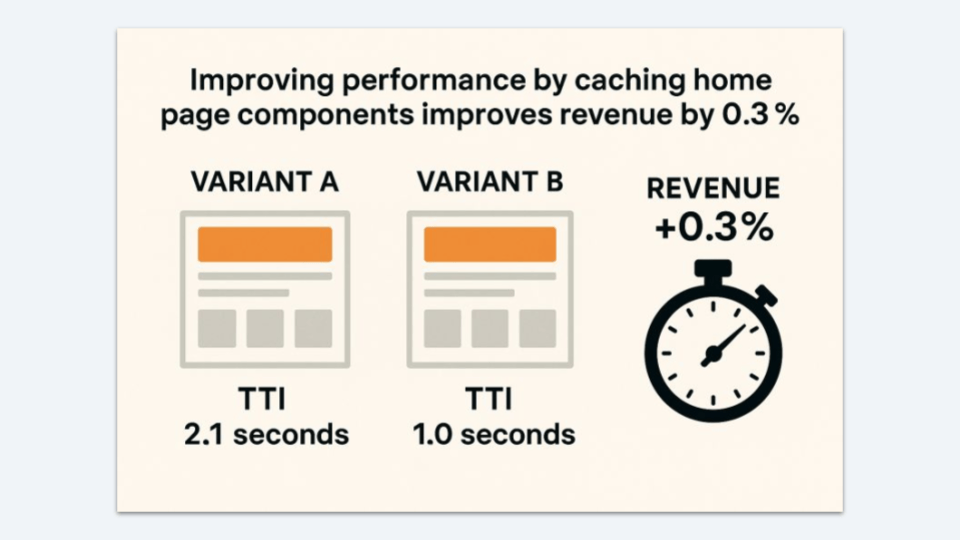
Good case studies do not shock with enormous numbers, but with the verifiability of the data.
What Good Case Studies Look Like: The Principles Are Causality and Transparency
A good case study focuses on causality (cause-and-effect), not mere correlation (simultaneity).
These are studies that can isolate the influence of speed from all other factors and verifiably link technical metrics with business results.
The main question you should ask is:
What method did the authors use to exclude all other influences?
Let’s look at a brief checklist that allows us to recognize a good case study:
- A/B Testing Method
Instead of a simple “before and after” comparison, the study should ideally use an experimental method (A/B, Split-test), where half of the users see the slow (control) version and half the fast (test) version at the same time. This isolates the influence of season, marketing, and external factors. - Statistical Significance
The results must be supported by statistical significance (e.g., p-value), which proves that the increase was not a chance occurrence. - Clear Business Metrics
The impact on Core Web Vitals is good, but the real impact on conversions is better. The impact on conversions, bounce rate, shopping cart abandonment rate, etc. And beware, it is ideal when not only percentage numbers are provided, but also absolute values, so we can be sure that the increase is not based on small numbers. - Transparent Methodology
Stating the sample size, test duration, and any simultaneous changes (e.g., only CSS was changed, not UX elements).
Is it difficult? Yes, and expensive.
But if we remain trapped in the cage of untrustworthy case studies, our field will not progress.