Pierre Lermant is an Enterprise Architect at Akamai Technologies, specialized in improving the performance, availability and operations of customer-facing web applications.
The same way website designers specify screen-width based breakpoints, TCP data transfer also works in step functions, whereby the amount of data that can be fetched per unit of time is rarely linear. An understanding of these download breakpoints allows us to maximize the asset sizes for a given number of round-trip to the origin servers. For instance, this can help answer questions like: Should my application fetch this JS separately, bundle it with another JS or paste it inline into the initial page html? Or, can I expect a load-time difference if my main hero image is 20% larger?
TCP 101 (and 102)
We illustrate below how TCP works for HTTP and HTTPS when a web asset is requested by a client with no existing connection to the target server.
Connection Setup
First a new connection must be established between the client and the server. RT # is the number of round trips.

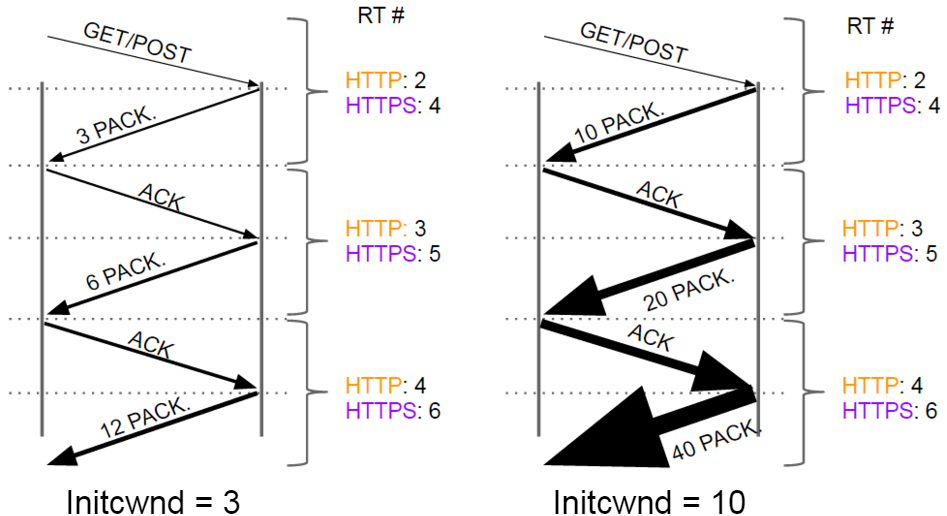
Slow Start
The amount of data exchanged right after the initial connection is primarily driven by the initcwnd (initial congestion window) parameter, almost universally set by default to 10 in modern servers. I also show initcwnd = 3 here for reference to older implementations and reinforce the positive impact of switching to 10.
This behavior is called TCP slow start

Steady State
After this initial ramp-up, the throughput is typically limited by either:
- The client receiving window size (RWIN), commonly set to a default value of 65.7 KB. Throughput
<= RWIN / RTT, RTT being the round trip time - Packet loss. Throughput , where the maximum segment size (MSS) is 1460 bytes.
1 <= C <= 1.3, we’ll useC = 1for the remainder of document - Connection bandwidth. Just to state the obvious: Throughput
<= Bandwidth
Throughput
Putting this information into a graph:

The line breaks indicate when the throughput switches from being RWIN bound to packet-loss bound.
When the RTT is short (<50 ms) users usually enjoy also great bandwidth (> 20 Mbps). When the RTT is longer (>50 ms) the majority of users, per Akamai state of the internet, still enjoys bandwidth > 10 Mbps, and therefore it is fair to state that the bandwidth is rarely a limiting factor on throughput. Only RWIN/RTT and the packet loss percentage are.
Download size implications
From the diagrams above, and assuming for simplicity no packet loss (not that uncommon for low bandwidth transfers), we can graph the amount of data that can be downloaded per connection.
Initial Connection:

This is where it gets interesting and actionable. We can readily see for instance that, for a fresh HTTP connection to a server with initcwnd=10, it would take the same time to download a resource 50K in size or 100K in size (4 RTT), however it would take another round trip to download a resource 110K in size.
Steady state connection:
Once the connection throughput has reached its steady state, either because of the packet loss or the RWIN limitations, the graph becomes more linear (packet loss incurs TCP restarts that can exhibit different behaviors based on the TCP flavor, which we ignore here for simplicity).

Summary
We used TCP well documented behaviors and known industry metrics to plot the amount of data that can be downloaded per connection for different scenarios. We can leverage the summary table below to help decide how to consolidate (or not) files and predict the cost of adding weight to images.
Max download size per round trip number, initcwnd=10, RWIN=65 K, no packet loss
| 1 RT | 2 RT | 3 RT | 4 RT | 5 RT | |
| HTTP, new connection | 0 (SYN) | 15 K | 45 K | 105 K | 225 K |
| HTTPS, new connection | 0 (SYN) | 0 (TLS Hello) | 0 (TLS Cyphers) | 15 K | 45 K |
| Steady state connection | 65 K | 130 K | 195 K | 260 K | 325 K |
