

Time-To-First-Byte (TTFB) is a popular performance metric, yet there are many problems and nuances with it. Not only does it have several different definitions, it is usually also a “compound” metric, comprised of many subparts. To make matters worse, several of those subparts are frequently zero or non-existent, often making it difficult to (meaningfully) compare multiple measurements or to debug issues.
During my job as a Web Performance Specialist at Akamai, I regularly come across questions (or even complaints!) from customers that are caused by different or mis-interpretations of this metric. I’ve gotten a bit tired of having to always repeat the same answers, so I thought I’d write down some of the common issues and nuances instead. That quickly turned into more of a short book than a single blog post though, so I decided to split it up into multiple blog posts/”chapters”.
In today’s Chapter One then, let us first focus on what is typically meant by TTFB and why the definitions differ. We will then discuss why it’s difficult and dangerous in practice to compare different TTFB measurements, as various factors can impact the measured or reported TTFB values, both inherent, intentional or even malicious (you shouldn’t hack TTFB, Vercel, it’s not even a Core Web Vital). We will end with a discussion on where to go from here with this supreme “magic number generator”. Strap in!
Future chapters will explore in more depth how specific technologies and features (like HTTP/2 and HTTP/3, 0-RTT, tight mode, and Happy Eyeballs) can impact TTFB. I will link those here when they become available.
NOTE: views and opinions presented in this blog post are purely personal and do not (necessarily) align with those of my employer, Akamai Technologies, nor the owner of this blog, Stoyan Stefanov.
Part 1: What’s in a Name?
One of the biggest problems with TTFB is that it has a large variety of different definitions, and that people are rarely clear about which exact approach they are using. This is because TTFB is typically a compound metric, composed of multiple subparts. Which of these subparts we do or do not include in the measurement can have a big impact on the reported value.
Especially in browser environments, we typically use the NavigationTiming (and resourceTiming) APIs to get performance metrics. These expose a collection of different timestamps that correspond to events when loading a web page/setting up a connection/loading a resource, see a partial annotated diagram of this below in Figure 1. As you can see, there is no single “TTFB” timestamp here; rather, implementers can pick their own “slice” of this timeline (a start and end time) to represent the metric.
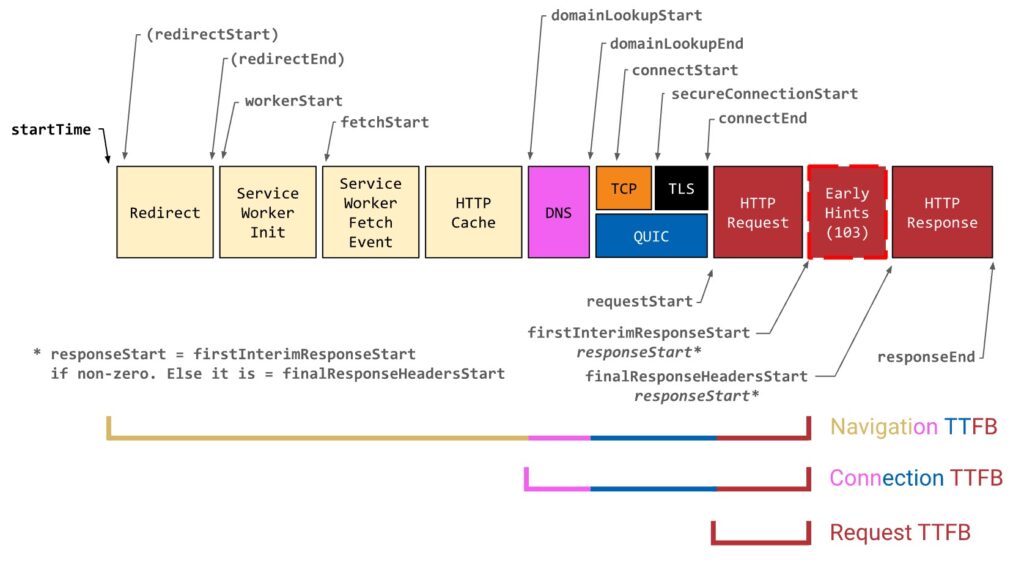
Figure 1: Annotated Navigation Timing API timestamps (original source)
Usually, people do (somewhat) agree on when the metric should END. As the name suggests, we typically want to know when the first byte of the HTTP response was received. This used to simply correspond to a single timestamp: responseStart. However, a recent new technology called 103 Early Hints makes things a bit more difficult, as we now have two possible moments that represent a “first response byte” (firstInterimResponseStart and finalResponseHeadersStart). This is a bit too technical to dig into here yet though, so I’ll keep that for later in the article 😉
For now, I first want to focus on when the metric should START, as there are many more possible starting timestamps to conceivably choose from. In practice though, there are roughly 3 common starting points that people use:
- Request TTFB, from
requestStarttoresponseStart: Arguably, the most logical starting point, as it indicates “when the HTTP request is sent” (when the GET, POST, PUT, QUERY, … gets put on the wire). This approach measures how long it takes for the server to reply to the request (combines network latency, server-side processing, and potentially CDN logic), and can be very useful in debugging “backend” issues. - Connection TTFB, from
domainLookupStarttoresponseStart: This expands Request TTFB by also including the time it takes to setup the connection itself. This can be useful, because in many cases, the client will not yet have a connection ready to go the moment it learns it needs to start fetching a resource. Additionally, the network performance is often determined by the same backend entity that processes the HTTP request (the CDN, the microservice backend-for-frontend, …), so it often makes sense to measure connection setup + request processing together (so you know if you need to blame your backend or your frontend team). - Navigation TTFB, from
startTimetoresponseStart: This is the broadest definition, including every possible thing that can happen before we get that first byte back (including redirects, service worker overhead and local browser cache logic). This variation of the metric is typically used for page navigations in a browser (e.g., in CrUX, and Google’s web-vitals.js), wherestartTimealigns with when “a visitor clicks a link or hits enter on their keyboard“, hence why I’m calling it “Navigation TTFB” (even though it can also be used for resources or outside browsers). This full compound metric can help give an idea of general end user experience, as their browser will go through all these steps. This is thus also the variant used as a component of other popular metrics like FCP and LCP.
At first glance, this might still seem manageable. Yes, there are two different end times, but only if you use that 103 Early Hints thing. And sure, there are three different start options, but they clearly cover different aspects of the loading process. So as long as people consistently use the same names to mean the same thing… well, I’m going to stop you there 😉 Because of course that’s not what happens.
We Can’t Seem to Agree on Things
In my experience, most people will define TTFB as what I’ve called “Navigation TTFB”. This is for example true for Google’s web.dev text (and as we’ve said, CrUX and web-vitals.js, which various Real User Monitoring (RUM) providers use), as well as this Calibre blog post. In contrast, this excellent DebugBear blog uses “Full TTFB” for my “Connection TTFB” and “HTTP Request TTFB” for my “Request TTFB”, but simply doesn’t name “Navigation TTFB”, see Figure 2 (at least in the diagram; the text is a bit more nuanced).
Fun anecdote: the web.dev page’s prose originally had a definition more akin to “Request TTFB”, while the calculation details were very clearly for “Navigation TTFB”. When I
confrontedasked the indomitable Barry Pollard about it, he agreed it wasn’t very clear, and updated the description. Thanks, Barry!
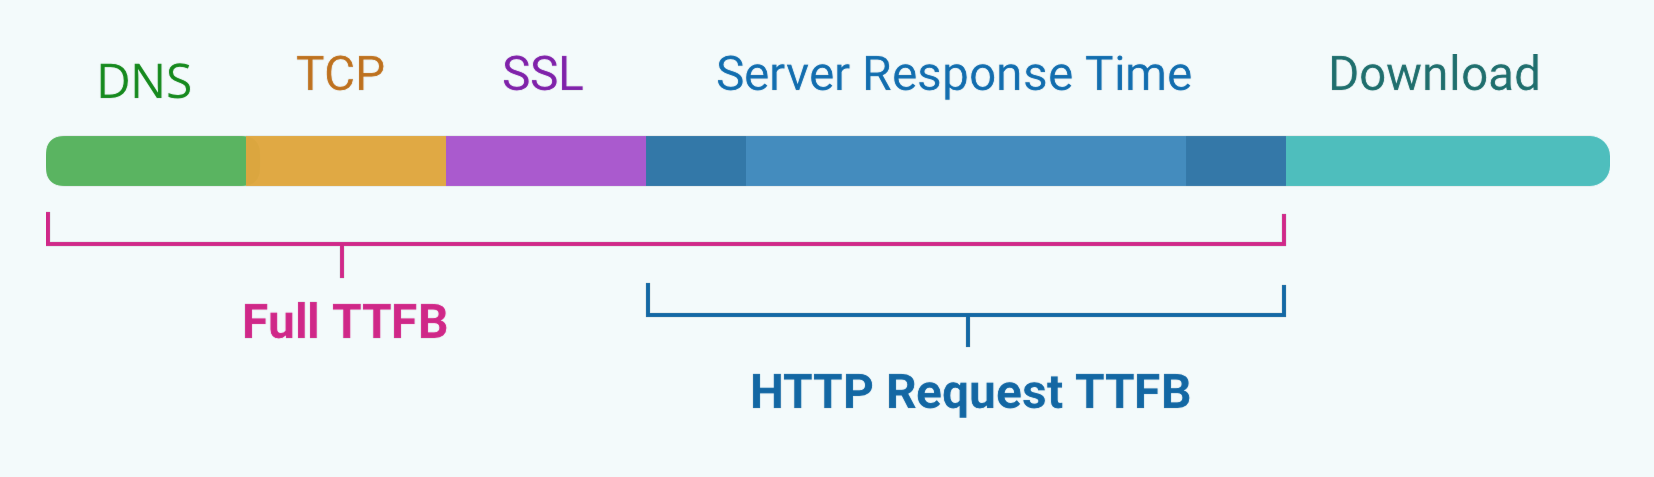
Figure 2: DebugBear’s version of my Figure 1, seemingly showing only Connection TTFB (“Full TTFB”) and Request TTFB (“HTTP Request TTFB”). Compare this to my Figure 1 and tell me who has a graphic designer in their team (source)
Interestingly, Wikipedia describes something very akin to “Connection TTFB”, not mentioning redirects or service workers at all. MDN is in my opinion somewhat contradictory, seemingly describing “Request TTFB” in the second paragraph (“between the start of the request and the start of the response”), making it seem like “Connection TTFB” in the first (again no mention of redirects), while indicating it can be measured like “Navigation TTFB” in browser APIs… I’m not quite sure what to do with that page to be honest.
We can see that, even in this small sample, there’s indeed no consistency in which of the three starting options people pick to mean “their” TTFB. Making matters worse however, is that some TTFB measurers don’t even really define it (or don’t stick to one definition)! Sometimes that’s ok, like Harry Roberts trying to be clever and focusing on stuff that matters in practice, rather than provide a full definition (nice try, Harry).
Sometimes however, it’s very much NOT ok! One of the most egregious examples is the (synthetic) testing company Catchpoint (which is used by many Akamai customers and also by Akamai internally). Across multiple public pages, they give various, contradictory definitions of TTFB (not even responding to people indicating said inconsistencies). Since they do synthetic testing, typically of individual resources/URLs and not through an actual browser, it is also difficult to know how their approach maps to e.g., the browser-based APIs and timestamps in Figure 1, as it is not publicly documented anywhere. They do have some additional documentation behind a login, but this is (imo) either outdated or still quite confusing/inconclusive. I’m apparently not alone in this, as astonishingly Cloudflare had to do A LOT of work themselves earlier this year to deduce what Catchpoint was actually reporting as TTFB. A direct quote from that article: “[we had to go] through all of their technical blog posts and comb through thousands of lines of raw data… to get functional definitions for TTFB”. Their end conclusion: Catchpoint basically measures “Connection TTFB” (which, imo, is still different from catchpoint’s hidden-behind-a-login documentation, as that also mentions redirects 🙄). Having gone through a similar exercise as the Cloudflare engineers myself last year, I can only sympathise with the frustration they must have felt. Spoiler Alert: one of my takeaways in the conclusion will be “ALWAYS document your metrics, exhaustively” (and publicly, come on guys…).
Fun anecdote: it’s not because someone gives a definition, that it’s also a useful one. For example, here Salesforce defines TTFB as “measured between when the server receives the http-request until the first byte (the first 8 bit) are received by the client“. I double-dare you to figure out how to practically measure that without getting an aneurysm (I do appreciate they clarify what they mean by the uncommon term “byte”, though).
Finally, I must cry mea culpa, as Akamai also does arguably weird things here. For example, in our DataStream CDN logs, there is a field called timeToFirstByte (which is very confusingly under-defined). Now, you might wonder: how can Akamai measure TTFB on the server in the first place… it only knows when the request was received, not when it was originally sent by the client? And you would be correct: we can’t actually measure “client-side” TTFB on the server (at least not without mPulse RUM). However, when a request arrives at the CDN we typically have two options: either the requested resource is in the CDN cache, or we have to “forward” the request to the origin, and for both options we can measure how long it takes until we can start sending the first byte back to the client! Put differently: this field doesn’t represent client-to-CDN TTFB, but rather CDN-to-origin/CDN-cache TTFB, see Figure 3. Two completely different things, and yet they’re called the same. And our documentation does nothing to clarify that. Madness.
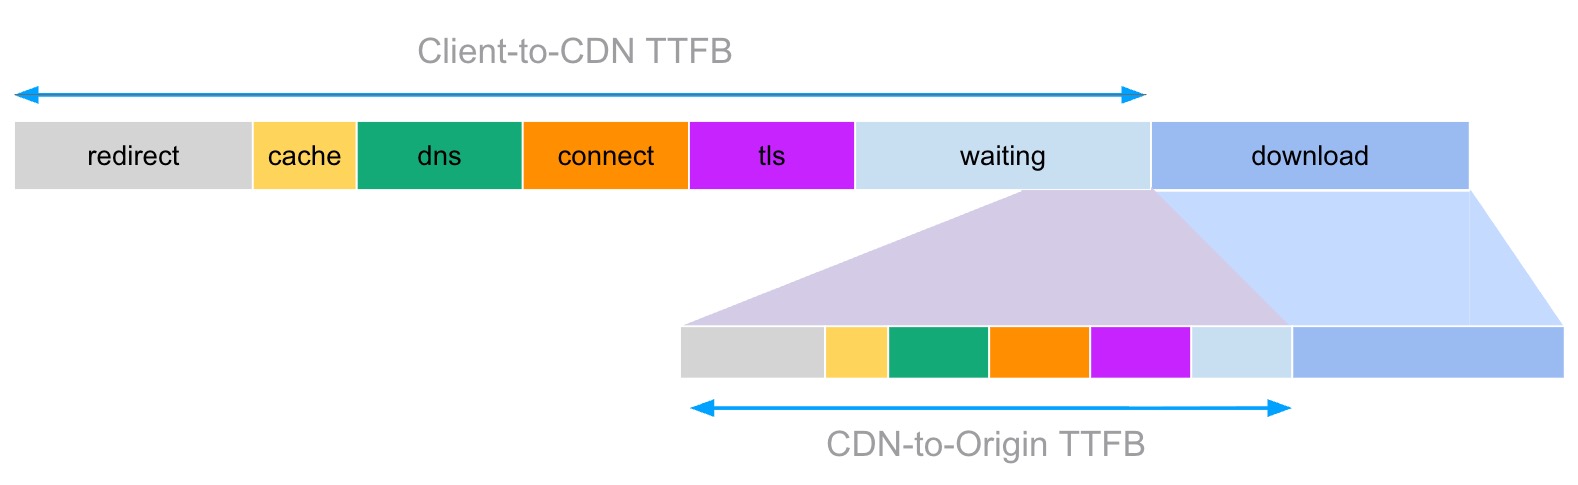
Figure 3: when using a CDN, there can be a whole second TTFB hiding within your first TTFB if the CDN has to forward the request to an origin.
Compare this to Cloudflare’s
edgeTimeToFirstByteMsfor example, who basically do the same thing (IIUC), but name/describe/define it much more extensively and understandably. It’s interesting to note that their metric includes TLS time, but not TCP time. What happens for HTTP/3 over QUIC (where the transport and TLS handshakes happen in parallel) is anyone’s guess…
As you could probably predict, the above isn’t even an exhaustive list, and in practice there are several situations where TTFB definitions are tweaked further depending on the situation (e.g., ignoring DNS or removing browser queueing overheads in Connection TTFB ).
Why Does This Matter?
I’m a stickler for definitions not just because I’m a pedant, but because it causes me a lot of overhead and headaches in my job. The main problem is that people are using all these different definitions for TTFB, but then somehow still try to compare measurements made with different assumptions.
I see this all the time: a customer complains about TTFB problems and sends us a screenshot of a graph in an undefined tool. What are we even looking at here? Which are the start and stop timestamps used? Synthetic or RUM? This matters because it helps figure out where the problem might be: Request TTFB doesn’t include DNS/TCP/TLS, so the problem will likely be in CDN overhead or edge caching problems. Conversely, bad Navigation TTFB might just be due to redirect overheads, not the DNS configuration. Just knowing the definition often isn’t enough to immediately know the exact issue, but it at least helps.
Again within the CDN context, the customer might mean the full Navigation TTFB (end user experience), while the account manager might assume Connection TTFB (as the CDN doesn’t influence service workers) and the engineer tasked with investigating the issue is looking up the CDN-to-origin TTFBs from the internal logs to see why the customer’s origin is misbehaving. It can take days for people to finally figure out they’re talking about (and measuring) different things. I’ve also seen teams go into panic mode, trying to throw all possible TTFB optimisations (improve DNS TTLs, add 103 Early Hints, change edge caching tiers, …) against the wall and hope that one sticks, instead of properly figuring out the main culprit. Hardly efficient.
It becomes worse when you use TTFB as a metric to actively compare two different setups. For example, if you have two competitors, one publishing Connection TTFBs, and the other Request TTFBs, the first is going to have a tough time convincing customers they’re the “faster” solution. If that seems like an unrealistic example, think maybe instead of a company using RUM data to measure Navigation TTFB on their current “live” stack (good old PHP monolith), but synthetic tests instead to measure the Connection TTFB of the in-progress “development” stack (hip new Next.JS microservices), as that wouldn’t yet get enough visitor RUM data to be useful. Erroneously comparing the results of these two (potentially very different) TTFB measurements might lead to some harsh truths being discovered when the new stack finally goes live… (that’s usually when a ticket titled “ESCALATION: URGENT” enters my mailbox).
Heck, you don’t even have to go that far. Just try to compare your RUM TTFB measurements with Google CrUX data… you’ll be surprised how different they can be. While there are many good reasons for that (we’ll discuss some below), you shouldn’t be surprised to hear I get questions about this almost weekly.
The final nail in the coffin however, is the fact that even when using the same TTFB definition, comparisons can be misleading or even downright deceitful. This is because there are many factors and (server-side) features that can be used to impact/manipulate TTFB (e.g., DNS TTLs, HTTP/3 support, 0-RTT, … which I’ll discuss in a later blogpost). As such, to get a fair comparison, you would have to measure TTFB on two exactly the same configs, that have the same features enabled. Otherwise, you’re only measuring what the platform currently DOES, not what it CAN DO. This is especially important in competitive scenarios:
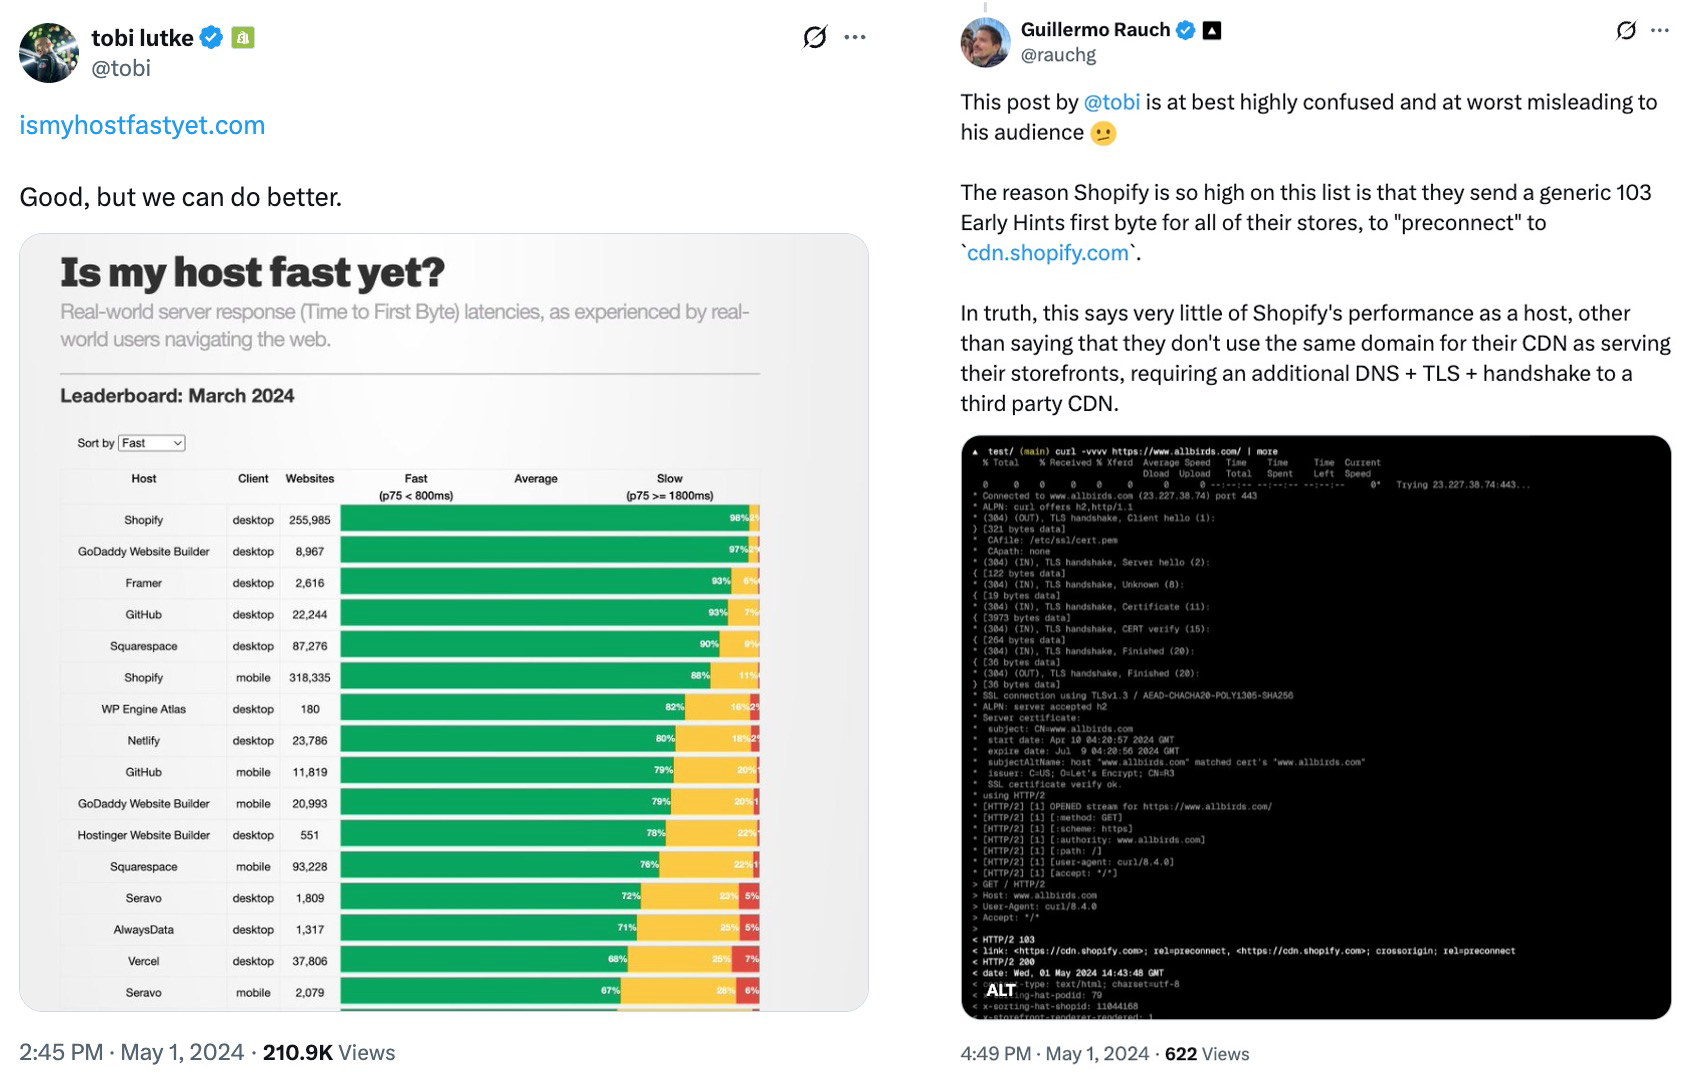
Figure 4: Initial tweet from Shopify’s CEO (left) shows their platform is the “fastest”. Reply tweet from Vercel’s CEO (right) claims this might be misleading.
Last year for example, there was a minor public “altercation” on Twitter between the CEOs of Shopify (a major e-commerce platform) and Vercel (a popular automated deployment and hosting platform), see Figure 4. Shopify’s CEO tweeted a nice chart ranking various hosting services on TTFB, which of course showed they were fastest! Soon after, everyone’s favourite genocide denier jumped on that, basically saying Shopify was cheating because they were using the new 103 Early Hints to make their TTFB seem faster than Vercel’s, who were not using them at that time. While it pains me to admit it, Triangle Man has a point here: Shopify’s framing isn’t entirely genuine, as other platforms could probably easily get a TTFB boost themselves if they would use 103 Early Hints as well. The measurement was comparing Shopify to what Vercel (and others) currently DID, not what they COULD DO. Good for marketing, bad for pedants.
Cloudflare does something similar in their yearly “performance updates”, even if they use RUM “TCP Connection time” (connectEnd – connectStart) rather than a TTFB variant. They seemingly compare the performance of different CDNs by downloading a single object hosted/cached on each across many real user sessions. However, for Akamai at least, we know that the object they measure is on a not-exactly optimized legacy config, missing some features such as DNS HTTPS records (to get more HTTP/3, 1 less round trip), or TLS session resumption (1 less round trip), despite both being possible on our platform. I cannot be sure, but it stands to reason that maybe the other CDN objects they test are similarly afflicted. It is therefore difficult to just believe their claims at face value: the results show Cloudflare is the fastest in most networks, but are they actually the “best” or are they just not comparing apples to apples? It is difficult to determine, because they also don’t release their full dataset…
Still, their approach is better than a recent Fastly blog post, which has one of the most bizarre methodologies I’ve ever seen (forget apples to apples, this is apples to wombat cubes). They seem to get CrUX TTFB and LCP measurements for a bunch of sites on both Akamai and Fastly and then just group all of them together into a single number per country. This is done without any regard for the sites’ actual configurations (e.g., edge cached or not), nor actual site composition (which can have an equal to much bigger impact on LCP than the CDN setup) nor do they seem to control for other statistical aspects (like population size). Again, without access to the raw dataset and full methodology, this type of result is essentially meaningless. As the saying goes: “there’s lies, damn lies, statistics, and marketing“.
Personally, I try to stay away from these types of direct comparisons (especially for high-level metrics like LCP) because it’s just nearly impossible to get fair results. I’ve written a bit more on this reasoning in one of my recent posts on the Akamai blog. If either Cloudflare or Fastly are interested in working together to ensure a fair comparison in the future, I’m listening 😉
A final example worth mentioning was when a customer currently at another CDN was using a synthetic testing tool (much like Catchpoint’s above) to compare their current Connection TTFB to an Akamai setup to see potential improvements if they switched. Sadly, the tool showed barely any benefits on Akamai, despite us enabling several improvements we knew for sure the other CDN didn’t have (HTTP/3, 103 Early Hints, 0-RTT, HTTPS DNS records, …). Turns out the synthetic tool simply didn’t support any of these new features, instead falling back to the “slower” equivalents also available on their current CDN. Despite using the same tool and the same TTFB definition, the results were still inaccurate.
And this all, dear Reader, is what really makes TTFB such a frustrating thing to work with. Even if you use the same definition and measurement setup, you can still get inaccurate, misleading and hard to interpret results. This is because there are simply so many different factors that can impact TTFB, and they all get wrapped up into a single number (especially with Navigation TTFB), making it very difficult to extract useful insights.
And yet, TTFB is still used very extensively in the industry… it’s used by (y)our customers, it’s used by (y)our competitors, it’s used by people who probably should know better. For better or worse, we’re stuck with it, probably for a long time, and so we have to deal with these ambiguities. And the first step to doing that, is documenting (some of) them so we have a common frame of reference. This is exactly why I wanted to write these blog posts, so lets look at a few important components to take into account in Part 2.
Part 2: Things to Watch Out For
Now that we understand the (non)sense of properly defining what TTFB means, and we have a conceptual feeling for why it’s difficult to compare measurements, let’s look at some things that can influence TTFB measurements in practice, and how this further influences comparability.
Quantum Subparts
Firstly, let’s explore with some examples why even TTFB measurements using the exact same definition can still wildly fluctuate. This is mostly because (especially when using Navigation and Connection TTFB), there are many subparts that combine into the final measurement (e.g., redirects, DNS, TCP), and these subparts by themselves are often highly volatile. They sometimes even don’t have a value/are non-existent, or their durations can alternate between high and low values. For example:
- For pages/resources without redirects, the whole
Redirectsubpart will be 0 duration (same for service workers). - The
DNSresult can either be quite large (if it’s the first time we’re resolving the domain) or very small (the IP is already in the local DNS cache). - When using a CDN, if the resource is cached at the edge, the
HTTP Requestsubpart will be much smaller than if the CDN has to go all the way back to the origin to fetch the content.
These are probably obvious to most readers. So let’s try two that are maybe slightly less obvious:
- If the resource was cached in the browser’s HTTP cache, all the subparts after
domainLookupStartwill be 0 duration (though the exact value of the timestamps is inconsistent between browsers, sometimes being equal to a previous timestamp, sometimes just being 0…) - If the resource was requested on an already established connection (say you request
example.com/main.jsafter first loadingexample.com/index.html), every timestamp beforerequestStartwill basically be the same value (0 duration), because the connection setup overhead is only attributed once: on the first resource requested on that connection. This is especially important when looking at navigations/page loads, as typically only the first page in a session (the “landing page”) will need a full connection setup. All subsequent pages are typically loaded on an existing connection, so should have a much faster (Navigation) TTFB.
Still too obvious for you eh? Ok hotshot, let’s see what you think about these following scenarios then 🙂
With HTTP/2 and HTTP/3, browsers will (aggressively) try to reuse connections, in various ways:
- It’s intuitive that a session within a single browser tab will re-use a connection, but what if you use multiple tabs for the same site? Or what if you’ve previously browsed to a site in tab A, closed that, and 3 minutes later opened a new tab B to go to the same site? In practice, browsers maintain persistent connection pools internally that can be re-used across tabs, so sometimes you might still get a low TTFB in a new tab, even though you might argue that’s a “new session”. It’s somewhat difficult to predict however, as connection lifetimes depend on things like idle network timeouts (which can be different per connection) and browser connection pool management heuristics.
- Connection Coalescing allows browsers to re-use an existing connection, even if it was opened for a different domain initially! So say the browser has already established a connection to load
www.exampleA.com/index.html, which then tries to loadimages.specimenB.com/main.avif. Logically, you might think the image would need a new connection, but not always! If browsers are sure the same server/IP is responsible for both the domains (for example, they’re fronted by the same CDN), it might actually send the request formain.avifon thewww.exampleA.comconnection! This mainly happens if the TLS certificate forwww.exampleA.comalso includesimages.specimenB.comin its list of “Subject Alternative Names” (again, common in some CDN setups). What this means for TTFB is that you might never actually see any connection setup overhead forimages.specimenB.comin your (RUM) measurements if its resources are always loaded on a “coalesced” connection. That might then lead to some weird outliers/contradictions when someone suddenly starts referencing the domain from a new site that doesn’t allow coalescing tospecimenB, or when doing synthetic testing directly tospecimenB, or when loading stuff fromspecimenBdirectly in the browser for “manual testing”. (And those are just a few problems you can encounter when coalescing stuff).
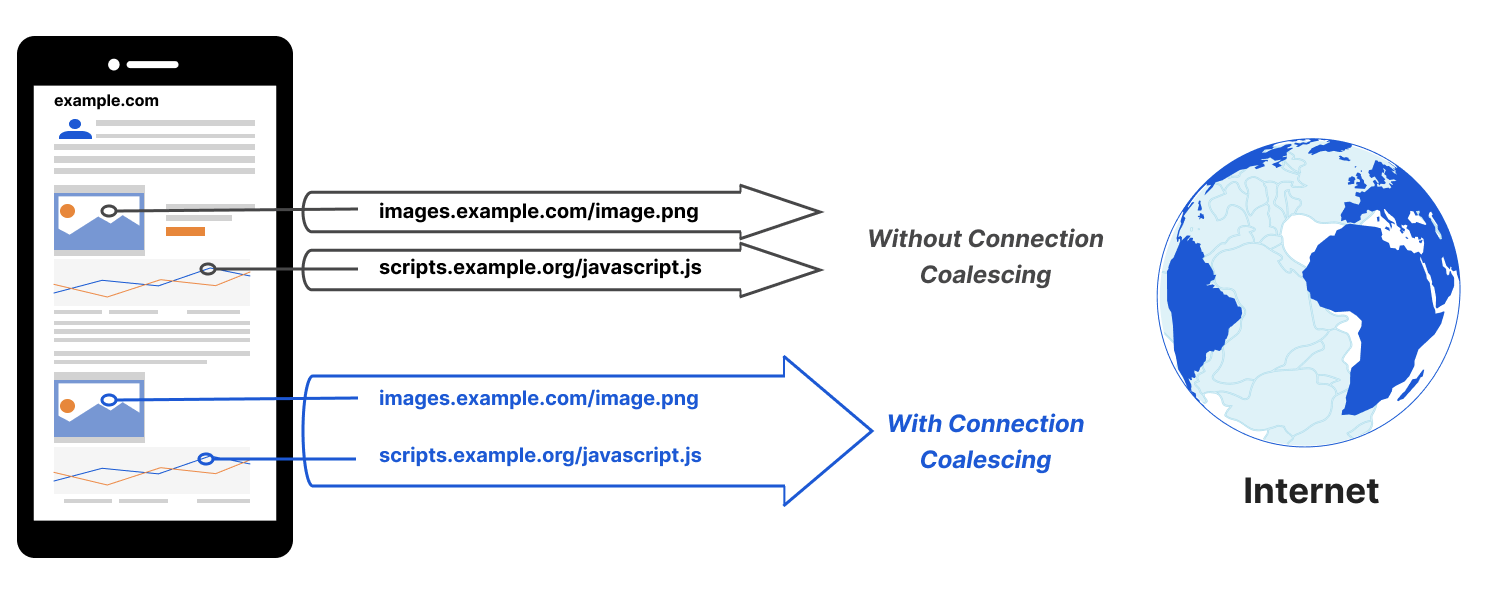
Figure 5: illustration of Connection Coalescing, which allows reusing a single TLS connection over different domains (source).
- Browsers don’t always reuse connections though, even to the same domain; sometimes they explicitly choose NOT to, for privacy reasons. You have probably encountered this yourself: if you want to use the
preloadresource hint for a font file, you have to add thecrossoriginattribute, or the preload will be useless. That is just one example though; several other types of resources (like JS modules) also “suffer” from the same requirement. The reasons for why this is needed are quite esoteric and stooped in ancient historical and anecdotal evidence, so I won’t go into much detail here (rather, go read these excellent overviews). What it means for our discussion today, is that the browser might re-use the same connection to load bothexampleA.com/index.htmlandexampleA.com/main.css, BUT it will setup a NEW connection to loadexampleA.com/font.woff2, even though they all share the same domain! It’s kind of like the exact opposite of connection coalescing… What this means for TTFB is that you might actually see a higher than expected measurement for some (types of) resources, since they require a new connection to be established after the page starts loading (at least in some browsers; Safari for example doesn’t really care, leading to nice and consistent RUM outputs… *sigh*). The Connection TTFB for the font might be slightly shorter than for the CSS though, since it can re-use the DNS lookup (as, again, they are the same domain). Isn’t this fun?
- Finally, again for privacy reasons, sometimes you might not get any (subpart) measurements back at all, even if they conceptually exist/happened! For resources loaded on “3rd party domains” (say
B.com), they should explicitly include aTiming-Allow-Originresponse header that indicates the loading domain (sayA.com) can access their timing info. Otherwise, all timestamps except forstartTime,fetchStartandresponseEndwill be 0. This can be annoying if you want to track which of your 3rd parties are slow to respond, but especially if you yourself use subdomains to load resources from. For example, if your page atwww.A.comloads images fromcdn.A.com, the latter will annoyingly be considered a “3rd party” as well, and the RUM script onwww.A.comwouldn’t see detailed timing info for any of your own images 😱 This is luckily an easy fix of adding the header, but in practice, this is often forgotten. It is also a big problem when you have cross-origin redirects (for example from advertisement providers): because they’re cross-origin, they’re not correctly attributed to theredirectsubpart, instead showing up as an undefined gap betweenstartTimeandredirectStart. This even lead to Tim Vereecke proposing a new metric, UNO, to help track these weird edge cases.
I could keep going, but I think the main message is clear: there are so many factors that influence how resources are loaded, it is almost impossible to predict what will happen or when. In this way, TTFB subparts are a bit like quantum particle properties: they can either exist or not, but you won’t know until you measure 🙂 (and even then, the result might be a dead cat…).
And yet, we often just toss all those different possible subpart combinations and measurements into one big pile, and call it “TTFB” (CrUX even lets you view TTFB aggregated across the entire origin and then extracts a single value at the 75th percentile, which is then deemed… representative?).
Let’s explore a bit more how this can lead to practical interpretation and comparison challenges in the next section.
Different Distributions
As discussed in the previous section, you can get radically different TTFB results, even for the exact same resource (say an HTML page), depending on if it was cached in the browser, or if it was reusing an existing connection or not.
Interesting sidenote: we can see that often, the three main TTFB definitions will “collapse” into each other depending on the situation. For example, the Navigation TTFB of a page that doesn’t have redirects or a service worker, will be (almost) identical to its Connection TTFB. At least if the page is the first one loaded in a new session (and requires a new connection). If not, the Navigation TTFB is essentially the same as the Request TTFB.
As such, in practice, many TTFB measurements will follow a bimodal (or even trimodal) distribution. If you plot them on a histogram graph, you would see 2 (or 3) clearly separated peaks, see Figure 6 below (which is different from a “normal” distribution (bell curve, Gaussian distribution), which typically has a single, centred peak).
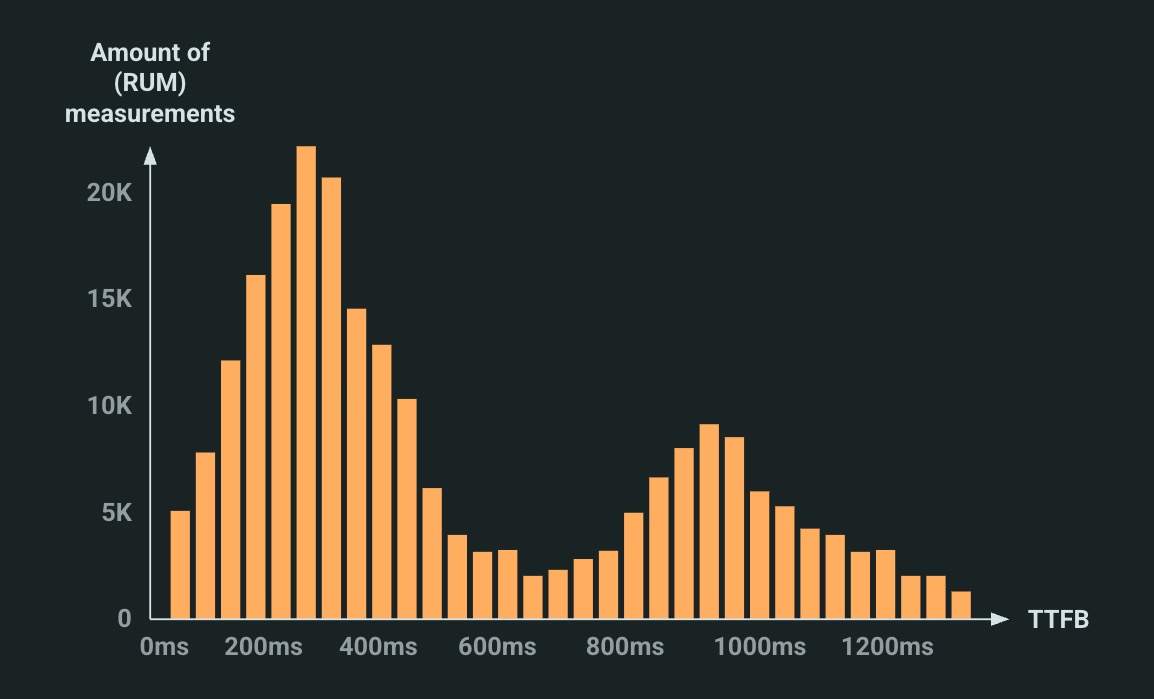
Figure 6: an (exaggerated) illustrative example of a bimodal TTFB distribution. High peak on the left (more things loaded on established connections) vs low peak on the right (fewer things over new connections). In practice, the peaks usually have more overlap, see for example here.
It is somewhat difficult to pick a single representative number for this type of distribution. For example, if you’d use the median (50th percentile) on the example above, you’d probably get something around 450ms, which hides the higher values completely. The 75th percentile will probably be a bit better of course, say 800ms (this is why for example CrUX also uses it), but that will still miss some important info. Now, you might say: that’s the whole point of using percentiles, Robin, you doofus! And sure, that’s true, but I’d argue that when used on a multimodal distribution (multiple peaks), you probably miss more important signals than when looking at percentiles for a normal distribution (single peak).
However, that is not even the real issue here. It only becomes really hairy when we try to compare different distributions to each other.
- An easy to understand example is synthetic vs RUM measurements. Synthetic tests will almost always use a new connection, while RUM measurements on real pages are much more likely to see a connection reused instead. As such, while the RUM distribution might look like the bimodal one above, the synthetic results might look a lot more like a normal distribution with a single peak around the slowest TTFB measurements in the RUM dataset. If you then again just use a single percentile for both, it’s likely the synthetic tests will lose (and, as discussed in Part 1, guess what is often used when testing a potential new solution…).
- A slightly more surprising example (maybe) is RUM vs CrUX measurements. Sure, everyone probably knows that CrUX only tracks a very specific subset of users: Chrome only (no other Chromium-based browsers), only for users that choose to share their info, doesn’t get any data from iOS, etc. So if you compare full RUM to CrUX, it’s pretty obvious you’re going to have a hard time. However, at least one of my customers knew about these common gotchas and properly filtered down to only (what they thought was) the proper subset in their mPulse RUM dashboards. And yet, they STILL saw a several hundred millisecond TTFB difference with the CrUX numbers. Looking at the worst performing pages in mPulse I quickly found the problem: these were mostly pages for logged in users, such as
/myaccountor/basket, things that by definition had to go to the origin server, and thus had a large TTFB. As these are personal pages, they were marked asnoindexin theirrobotsmeta tag. Turns out that havingnoindexdoesn’t just prevent the pages from showing up in search results; they also get excluded in CrUX as well. For this specific site, they had a lot of views on those types of pages, skewing even the p75 quite a bit. Now, to be fair to CrUX, this is documented somewhat clearly, however still not entirely (to me)… the documentation says “If the origin is publicly discoverable, then all page views within that origin will be included in the origin-level data, but URL-level data may not be available“. To me, that reads as though thenoindexpages also should be in the global CrUX data, but the comparison to the RUM data seemed to contradict that. The broader takeaway from this is that it can be difficult to (perfectly) match two distributions from different measurement populations, even if you (think you) know the exact parameters. Now imagine comparing your RUM Core Web Vitals to those of your competitors via CrUX… (don’t lie, I know some of you do this ;)).
- The final nail in this coffin however is that two CrUX distributions don’t even necessarily overlap for two CrUX metrics. For this article, this is most salient for TTFB and LCP. Again, this is somewhat clearly documented though, with the TTFB explanation clearly stating it is only collected “on full page loads, unlike LCP, which is also collected on back-forward navigations and prerendered pages“. It also literally mentions “the sample size of TTFB can be smaller than other metrics and may not necessarily be compared directly with them“. What this means in practice, is that TTFB improvements (or, if you’re lucky, deteriorations) might not necessarily reflect/show up in other related metrics like FCP and LCP. Not because those other metrics didn’t improve, but because the distributions/populations for both metrics are different and because CrUX only extracts that one p75 number. Put differently: if your TTFB optimisation was visible for 50% of your pages, but only made the LCP faster for the worst 23% of your page loads (as not all LCP elements are TTFB-bound), it would show up in one but not the other (I have a nice real-world example of this below when talking about 103 Early Hints). Ah, statistics.
Fun anecdote: If you’re like me and you read the “on full page loads” above, you might have wondered: what exactly is a “full page load” though? Does this include pages loaded from the browser cache? Or even pages that didn’t require a full new connection? When I started writing this article, this was not detailed further. However, after asking the indefatigable Barry Pollard for clarification, he went ahead and just updated the article for everyone, making it clear that “TTFB in CrUX will include cold page loads, cached page loads, and page loads from an established connection“.
To round off this section, let me tease that there’s a cool combination of both “RUM vs CrUX” and “CrUX vs CrUX” together in the same situation that ends up making your CrUX TTFB worse, while both your CrUX LCP and RUM TTFB improve. We’ll discuss that below when talking about speculation rules 🙂
Let me also state very clearly that none of this is meant as a dunk on CrUX. I think it is an excellent project and their approach very understandably has some inherent limitations. I think they could often be documented somewhat better… but these issues with different distributions etc. are just inherent in all of this, not because “Google is doing something weird”.
The main problem is thus primarily that the people looking at and interpreting these metrics are often not aware (enough) of these underlying issues, often again leading to misinterpretations and bad comparisons. The problem is commonly also in the visualisation tools, which often show only a single/a few derived value(s) (e.g., the median, p75, average, etc.) over time instead of showing (at least the shape of) the distribution. If it’s not obvious why this is a problem by now, let me drive home the point by referring to the “Datasaurus dozen“, a set of 13 (what’s in a name) completely different datasets with different distributions that nevertheless share the same “summary statistics” (mean, standard deviation and correlation). As such, if you’d look only at those numbers, you’d assume they were all the same. It only becomes apparent when looking at Figure 7 below how wrong that is.
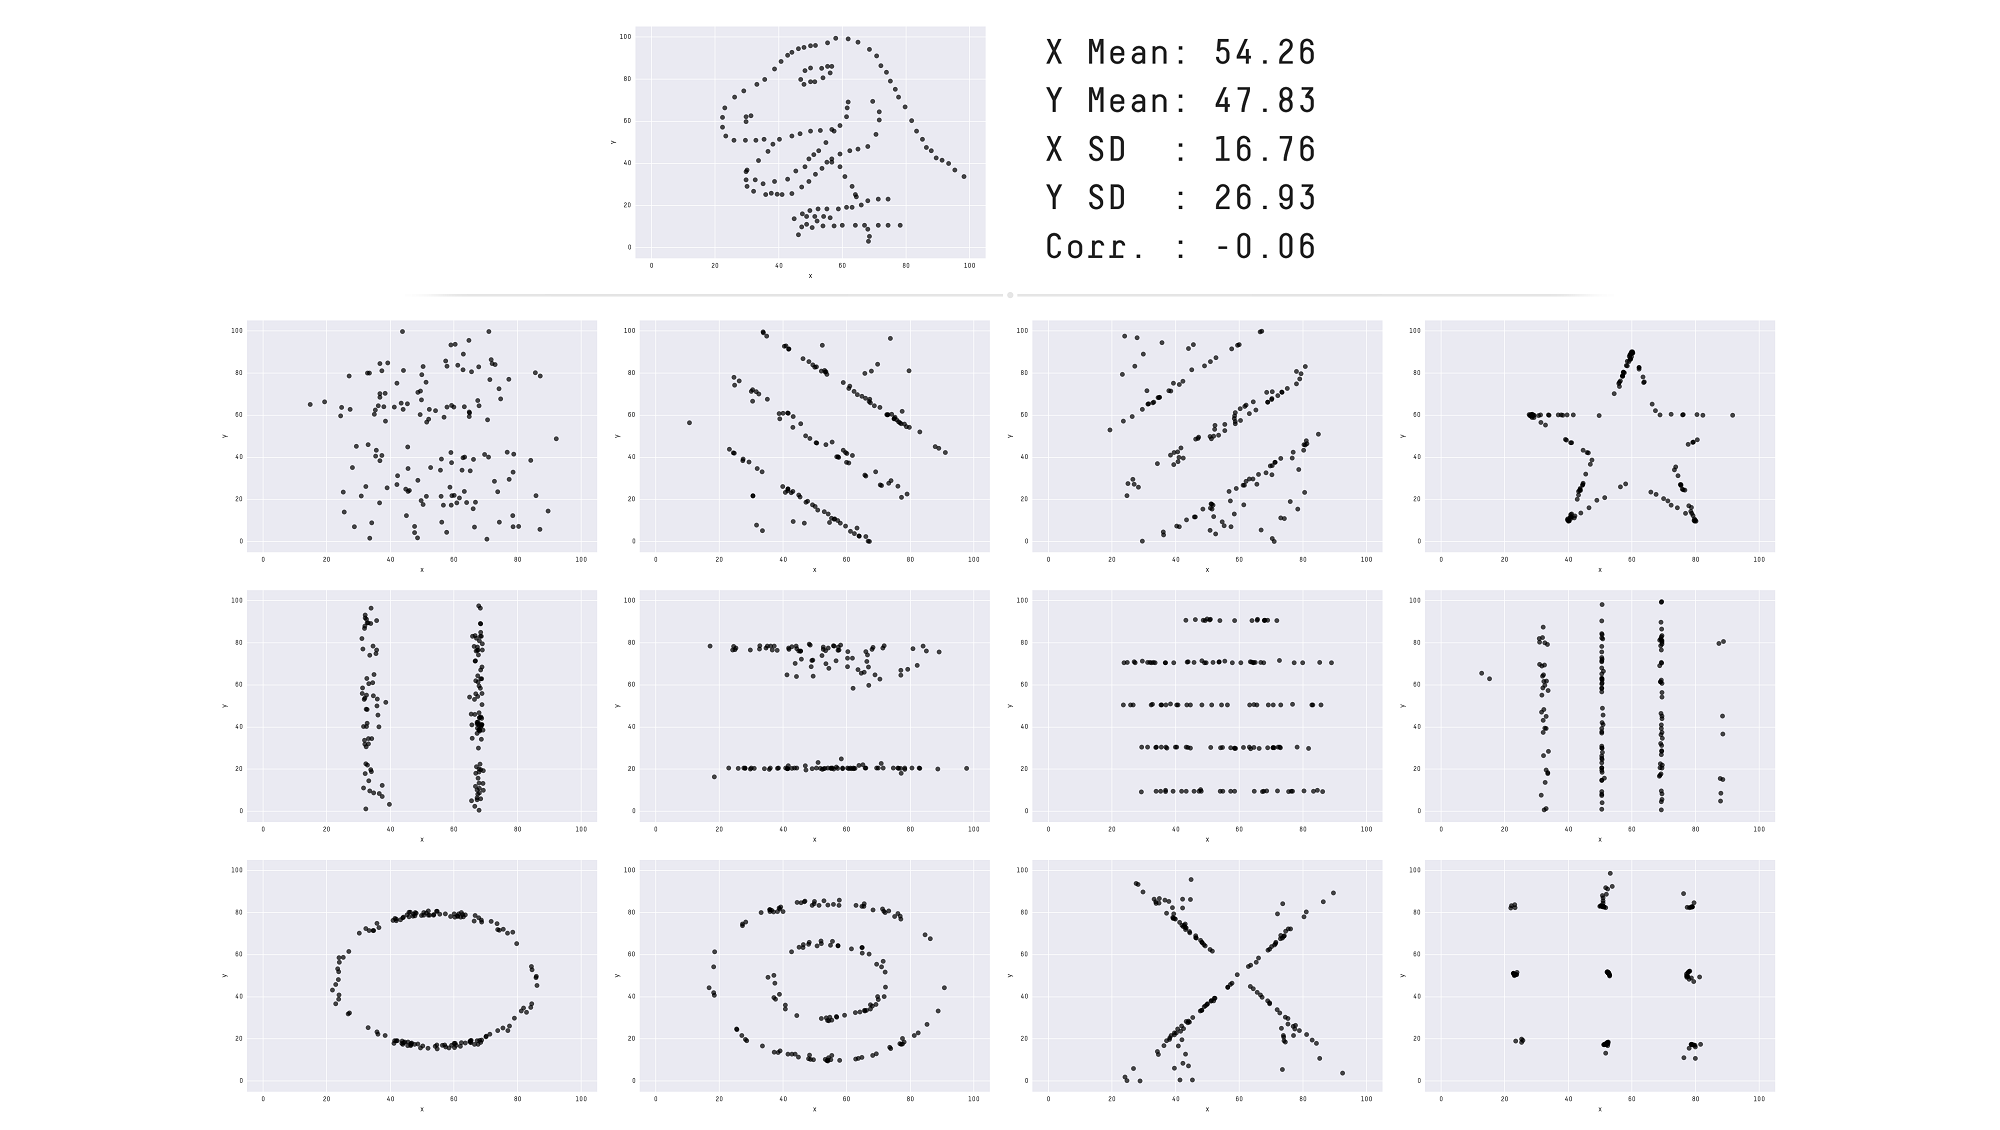
Figure 7: The “Datasaurus Dozen”, a group of wildly different datasets that share the same summary statistics values (source).
Now that we’ve looked at some arguably high-level problematic aspects, let’s start diving deeper into some specific technologies that make measuring TTFB challenging or have led to changes in TTFB measuring approaches.
103 Early Hints
Until now, we’ve mostly focused on differences in the START timestamp for TTFB (Navigation vs Connection vs Request). However, as mentioned in the introduction, recently there have been some discussions about what should/could the END timestamp be as well. This was caused by the new 103 Early Hints HTTP status code.
While they are often forgotten in discussions, the long-established 1xx class of HTTP response codes indicate “informational responses”. These typically don’t count as “final” responses, but rather carry some temporary/intermediate feedback/signal from the server, and should later be followed by another response (a 2xx, 3xx, 4xx or 5xx).
103 Early Hints is thus an example of such an intermediate signal, which can help improve Web performance if an (HTML) response is slow to arrive by giving the browser something to do in the meantime, instead of just waiting. This is again a common scenario when working with a CDN: the HTML page might not be cached at the edge, and thus needs to be fetched from the origin. However, usually some of the needed JS/CSS/Fonts/… WILL be in the CDN cache. Wouldn’t it be great if the browser could already start downloading those, even while the HTML is being prepared at the origin? That is exactly what 103 Early Hints allows us to do!
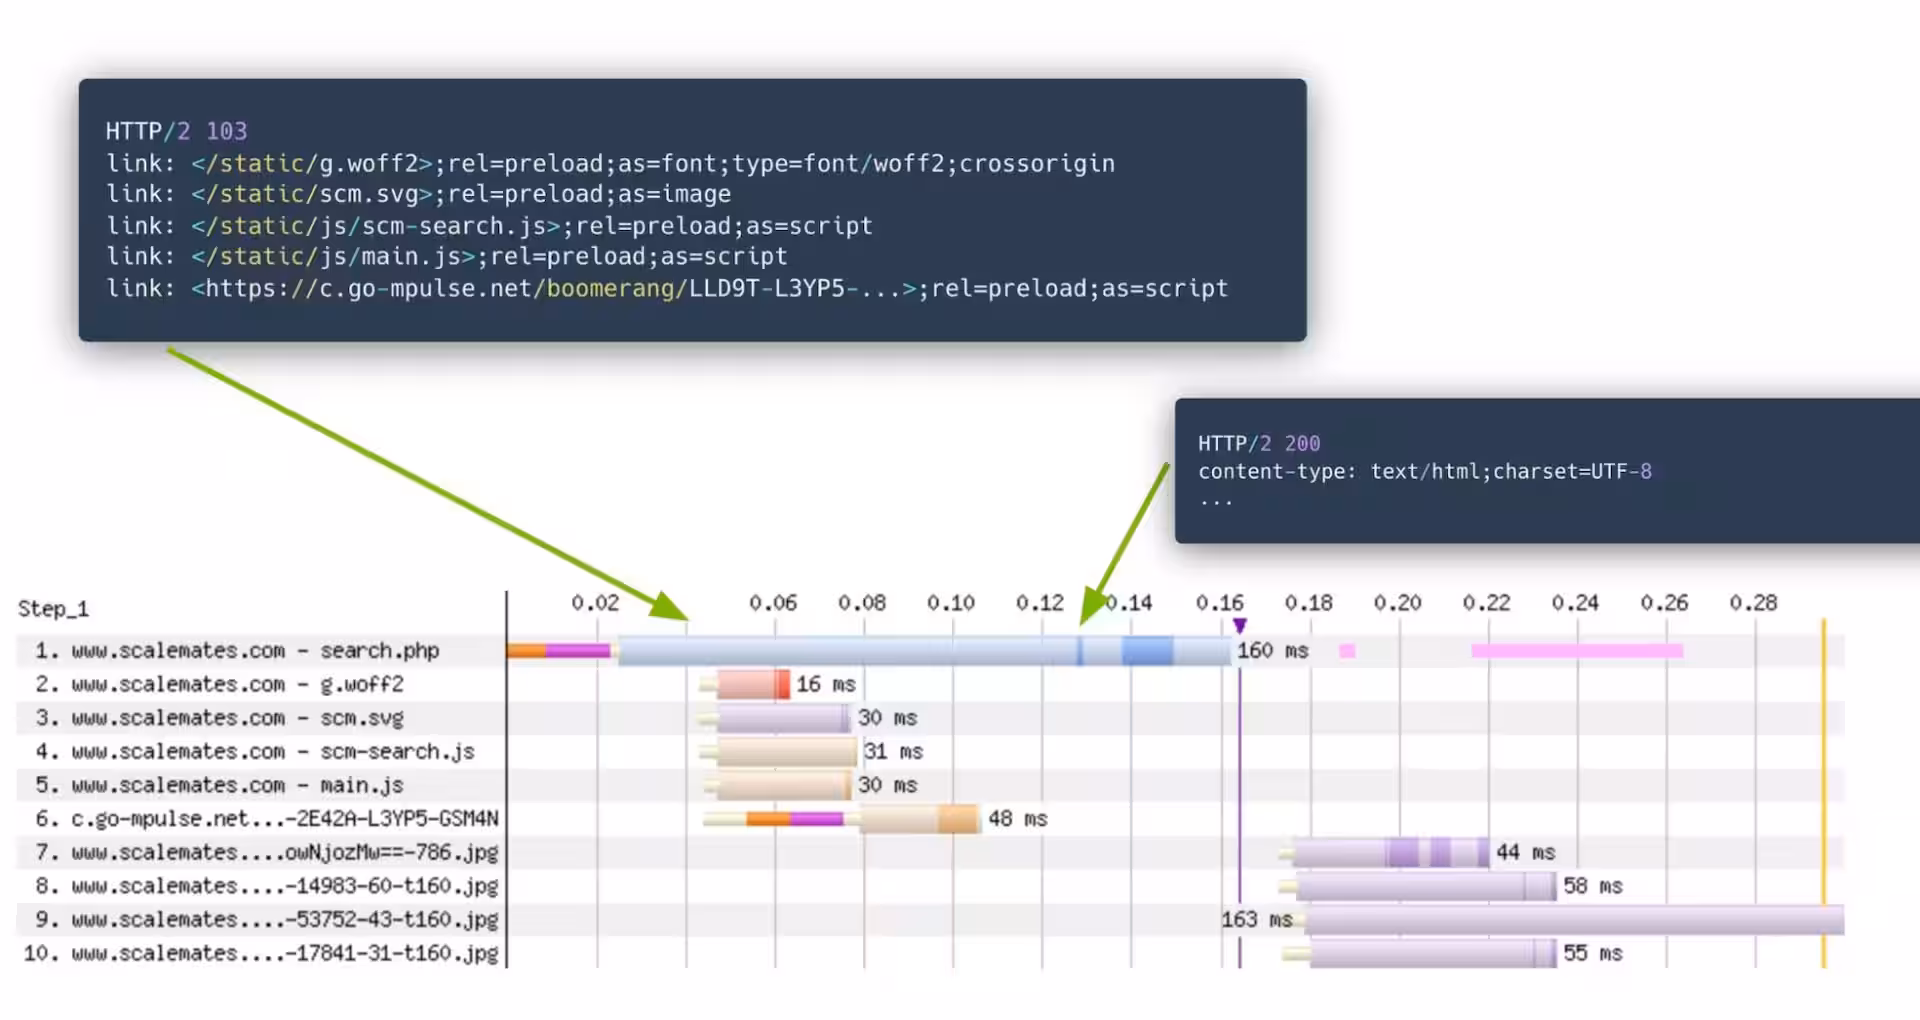
Figure 8: 103 Early Hints in action. Before forwarding the request for the search page to the origin, the CDN edge already sends a 103 Early Hints response with several preload resource hints to the browser, which can fully download them all before the first bytes of the page results get back (source).
The mechanism here is pretty simple: it just re-uses the existing preconnect and preload resource hints, and sends them in HTTP response headers with the 103 status code. The browser can then decide to create those new connections/preload those resources even though it hasn’t seen the HTML <head> yet. As you can see in Figure 8, this can be very powerful!
Blast from the past: fellow oldtimers might think “Well… that sounds a lot like HTTP/2 Server Push!“, and they would be correct. I however don’t want to go into too much detail about that here. Luckily I discussed this in some depth in a conference talk from a while back; please watch that instead 😉
While this is again great for performance, it poses the question: what exactly constitutes the “First Byte”/responseStart in this setup? You could argue it’s the 103 Early Hints response, as that obviously arrives first AND also carries some useful signals. However, you could also argue it’s still the “normal” 200 response, as that carries the actual response data for the original request (and, if not using 103 Early Hints, it would also be the 200 response. Yay, consistency!).
Predictably, for a while nobody really agreed on the best approach: Safari and Firefox had no strong opinions and just kept the existing behaviour, which counted 103 Early Hints as the First Byte (as it’s indeed literally the first byte arriving from the server). Chrome however decided to go for the “final” response instead, adding a new firstInterimResponseStart timestamp for people who also wanted to know when/if the 103 came in. As you might imagine, this made the already inconsistent TTFB measurements even worse: on Safari and Firefox, TTFB suddenly markedly improved, while on Chrome (and thus also in CrUX!) it stayed the same. This has made a lot of people angry, and has been widely regarded as a bad move.
This was then followed by a period of respectful discussions and deep introspection, at the end of which the Chrome team decided to revert to the previous behaviour for interoperability’s sake, and thus Chrome now also considers a 103 response to represent the First Byte (if it exists). It was agreed to add another new timestamp to ResourceTiming, called finalResponseHeadersStart, so people can still measure when the 2xx-5xx response came in, if they want to. As such, if there is a 103 response, responseStart will be equal to that. Otherwise, it will be equal to finalResponseHeadersStart (as also indicated on the bottom left of Figure 1).
Why the history lesson? Well, to help you understand why using 103 Early Hints can have such a dramatic impact on your TTFB measurements! The results can be truly ridiculous, with one of my customers improving their TTFB from a ridiculous 3s to an acceptable 600ms in a month. Similarly, my colleague Tim Vereecke is constantly optimizing his personal website www.scalemates.com. He already had 103 Early Hints on his landing pages, but recently started sending them on all pages. As you can see in Figure 9, this cut his already excellent p75 200ms TTFB IN HALF to just 100ms in CrUX.
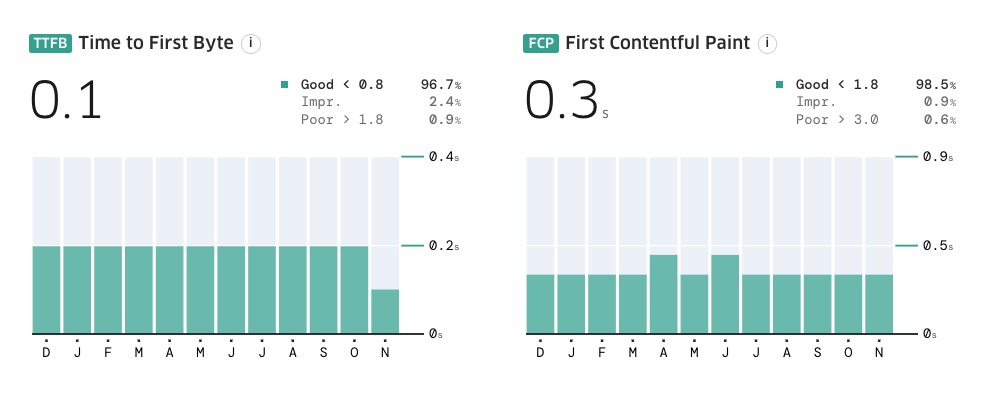
Figure 9: Tim Vereecke’s scalemates.com saw a marked drop in TTFB after sending 103 Early Hints on all pages (instead of just landing pages), but there’s no corresponding change in FCP (or LCP).
Fun anecdote: within Akamai, Tim is often referred to as “the Speed Wizard”, “the Performance Guru” or “the Annoying Belgian”. All well-deserved.
It is however also important to note that improving TTFB (with Early Hints or otherwise) doesn’t necessarily also improve other, related metrics like FCP and LCP (the FCP in Figure 9 clearly doesn’t budge, despite the TTFB bisection). This is partially because TTFB and FCP are measured on different populations in CrUX; see the discussion on different distributions above. However, it is also a reminder that, while TTFB is a part of FCP/LCP, it doesn’t necessarily directly correlate to changes in those values. After all, it’s just 1 of the 4 LCP subparts, and you cannot yet Early Hint responsive images, so if the LCP element is an image, it’s more difficult to directly influence it this way.
Why all the extra details? Well, to help you understand how useless it is to use 103 Early Hints just to get a better TTFB. Usually of course, the 103 response will contain useful stuff that helps improve performance in other ways as well. However, there are also certain parties that indeed just try to manipulate TTFB with an essentially useless 103 response, to deceive the uninitiated. Case in point, the Triangle Company, Vercel. As discussed before in Part 1 and Figure 4, Vercel had some coarse words for Shopify when the latter shared some TTFB measurements showing they were the fastest hosting platform. Vercel claimed they were only that fast due to the use of, you guessed it, 103 Early Hints! And that the Shopify hints weren’t even that useful, just sending a single preconnect for cdn.shopify.com (which arguably is somewhat useful, but perhaps indeed not as much as the TTFB difference indicates).
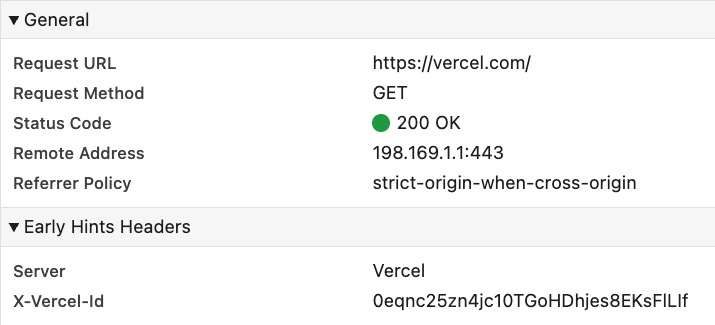
Figure 10: vercel.com is still sending a 103 Early Hints response without preconnect or preload resource hints, which is essentially useless.
Despite that social media posturing, Vercel soon after apparently decided that public perception through comparison websites was more important than taking the moral high road, and started adding their own 103 Early Hints as well. However, seemingly as to prove a point, even today their 103 is more useless than Shopify’s ever was (see Figure 10 above): it essentially does nothing besides artificially improve that all-important TTFB metric.
However, the joke is entirely on the cheaters. The decision-driving comparison website stopped updating in November 2024 (please come back, Rick!), and Vercel is still ridiculously below Shopify (twice). More importantly though, Shopify in the meantime kept iterating on their approach, evolving into a much more nuanced use of 103 Early Hints that now actually shows measurable LCP improvements for their customers. To be fair to Vercel, they have also found ways to improve performance: for example by (checks notes) prefetching over 40MB of resources just to appear fast on a, you guessed it, synthetic benchmark. I’m not a big fan of twitter-driven optimisation myself.
Side note: am I letting my personal dislike for Vercel’s CEO cloud my judgement? Of course. Are there also decent people at that company doing decent work? Also of course. Should you ever participate in metric hacking just to fool the masses? Of course NOT.
In conclusion, I love how 103 Early Hints is such a wonderful example of how a seemingly simple new feature can end up having major ripple effects. It teaches us about the dangers of retroactively changing established conventions (what responseStart means), of only really starting standards debates after dashboards start breaking, and of chasing a metric just for the metric’s sake. All in one little package, preceded by the number 103.
Now, before you read on, take a break and go check if your favourite synthetic testing tool has support for 103 Early Hints and what it deems to be the “First Byte”. I’m willing to bet money it’s not even mentioned once in their hidden-behind-a-login “documentation”.
Speculation Rules and ActivationStart
As if changing when TTFB can END with 103 Early Hints wasn’t enough, an even more recent feature also heavily changed when it can START (because everything’s made up and the points don’t matter).
Still, the Speculation Rules API is one of the coolest new technologies on the block for helping improve Web Performance. It essentially provides various ways to get the browser to start loading (and even fully rendering!) a Web page early: for example, instead of waiting for a click on a link, the loading process can start the moment the user hovers over the same link, saving a few 100ms! This was of course possible for a long time already with JS (e.g., with something like turbolinks), but now it’s possible to do this directly via a browser API (at least in Chromium)! You provide a small bit of JSON to describe which URLs should be prefetched or prerendered (which can even be based on CSS selectors, very nice!) and then the browser does the heavy lifting for you.
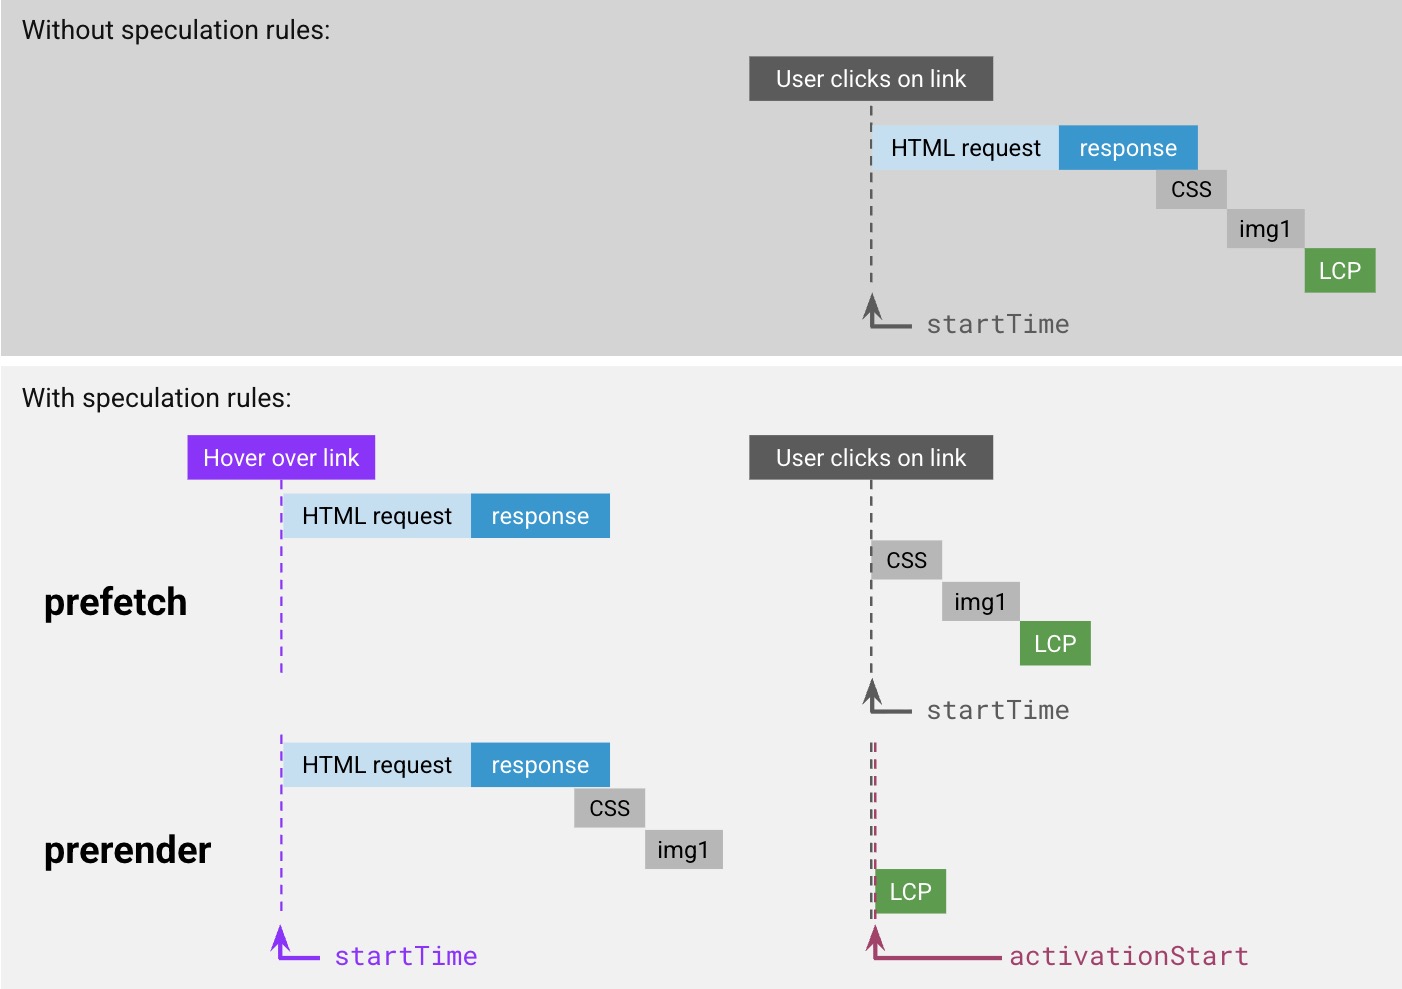
Figure 11: Example of how speculation rules work when triggered by a link hover. prefetch waits after downloading the HTML, while prerender effectively loads the entire page.
I again don’t want to go too deep into how this works, but rather focus on its (hopefully obvious) potential impact on TTFB. After all, in Part 1 I said Navigation TTFB in particular starts when “a visitor clicks a link“. However, with speculation rules, a lot (or all!) of the work (redirects, checking cache, setting up new connection, downloading HTML even) will have happened before the actual click occurs (see also Figure 11)! So the question becomes: what do you report as TTFB? Do you include all that work that potentially happened before the click or not? There are roughly two competing viewpoints here:
- Using TTFB as a way to debug potential backend/network issues: from this perspective, it would make sense to just report the full TTFB numbers as if it was a “normal” page load, as of course all that work still happened, even if the user didn’t notice (most of) it.
- Using TTFB as one of the ways to measure end-user experience: from this perspective, it makes more sense to just measure the TTFB as zero-duration, as the end user will not see its impact directly if a page load was “speculated”.
Note: there are of course many edge cases here, where the HTML loading didn’t actually fully complete before the user clicked the link proper (say we’re still busy with a long redirect chain). In this case, option 1 would still measure the full TTFB as usual, but option 2 would conceptually report a “partial TTFB”, beginning from when the actual click happened, but ignoring the subparts that happened before that.
You could make a good argument for both of these approaches, depending on the setting and intended use of the metric. For example, it should be no surprise that CrUX (the Chrome User Experience report), has chosen option 2. Similarly, web-vitals.js also measures from the actual click onward, while Harry Roberts even explicitly states that the ultimate goal of the speculations is to “pay the next page’s TTFB (prefetching), FCP, and LCP (prerender) costs up-front“. Even our own mPulse RUM defaults to option 2 as well.
This however does mean that I struggled to find good public examples of people using/describing option 1, which was a bit surprising. After all, as someone who is often debugging networking performance, I would have expected a few more implementations to prefer option 1. Otherwise, if you have a ton of speculated page loads, you will have a bunch fewer TTFB measurements to help you out. On the other hand however, if the TTFBs are fast enough so they always complete before the user clicks anyway, then maybe they’re fast enough and I just should stop worrying? 🙂
Digging a bit deeper into this however, I found out that measuring the full TTFB is actually only even (easily) possible for prerender, but not for prefetch:
- For
prerender, a special new timestamp calledactivationStartwas added to NavigationTiming, to make explicit the difference between when the page starts “loading” (startTime) and when the page is actually shown to the end user/becomes “active” (activationStart), see also the bottom row of Figure 11 above. In this setup, you can still measure and report the full Navigation TTFB (responseStart–startTime), it’s just that a lot of implementations in practice choose not to (they doMath.max(responseStart - activationTime, 0)instead, see for example web-vitals.js).
- For
prefetchhowever, there is no new timestamp (activationStartis only for prerender). The way this works is that the prefetch is not actively tracked; it’s seen as a request belonging to the previous page that puts the result into the browser’s in-memory cache. Then, when the user actually clicks the link, the page is loaded from that cache. In the browser NavigationTiming API then, this looks (almost) identical to a non-speculated page loaded from the HTTP cache, withstartTimebeing equal to the click, see the second row Figure 11 (if the user clicks while the prefetch is still ongoing, the cache will take a bit longer to answer though). Consequently, we miss the opportunity to measure the full TTFB within the context of the new page (startTimeis always when the page is done loading from the cache). You could conceivably catch the TTFB as part of the previous page though, but that’s quite annoying in practice in most tools.
Side note: given the above, I’m sure there must be plenty of implementations that use option 1 in practice (at least for prerendered pages), even if I couldn’t easily find any. I suspect this simply because option 1 doesn’t require any code changes (it still just uses
startTimeas the initial timestamp), while option 2 requires a conscious choice (explicitly using the newactivationStartas the reference time). Consequently, if you’re using speculation rules, this is maybe another good time to take a break and look at the documentation of your RUM tooling to see what’s actually happening 🙂
I’m sure there are some good reasons for approaching things this way and for not using activationStart for prefetch as well (or for not keeping startTime as-is and introducing a negative-time speculationStart or something) and I won’t complain about that. I will however lament the end result of us having even more inconsistencies in how TTFB can be both calculated and defined/reported when using the Speculation Rules, even dependent on the type of speculation done…
This is especially true when we look specifically at CrUX again. As I promised you above when talking about distributions, there is a “fun” situation here in which RUM will disagree with CrUX, and CrUX will even disagree with itself! This was originally reported (at least to me) by Tim Vereecke (again), who added speculation rules prerendering to his scalemates.com site. While he saw the expected LCP improvement in both RUM and CrUX, and some nice TTFB gains in mPulse RUM, he also saw a decidedly unexpected TTFB deterioration in CrUX, see Figure 12 below! How could that be, as prerender should obviously improve TTFB?!?
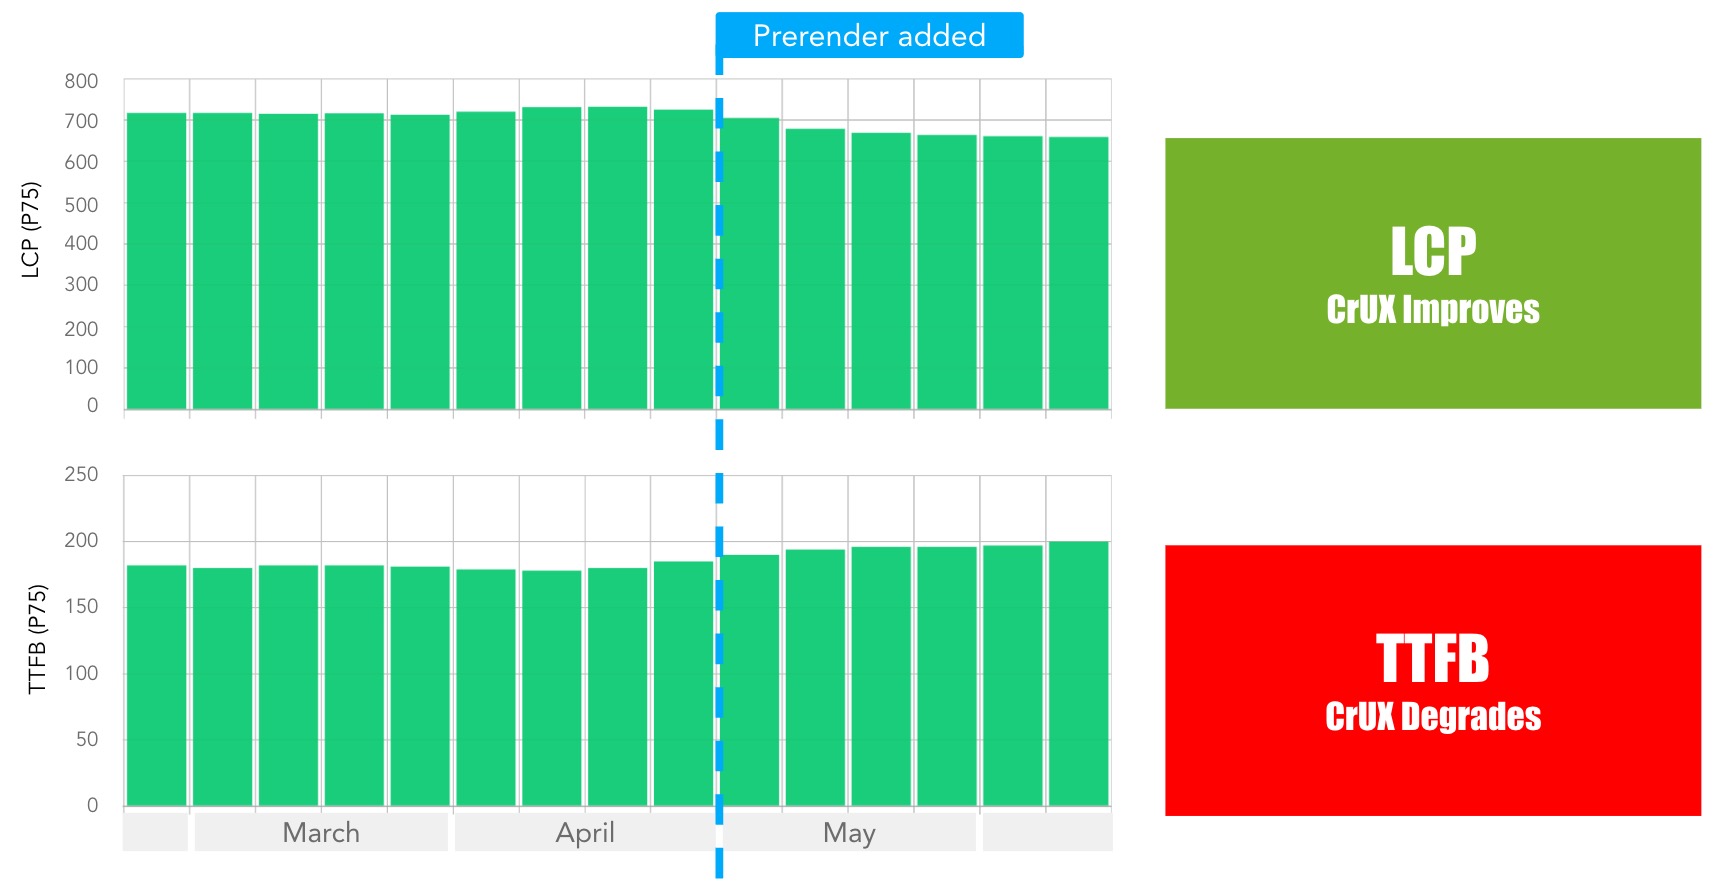
Figure 12: after adding prerender speculation rules, Tim Vereecke’s LCP improved, but the TTFB unexpectedly degraded in CrUX.
This seems quite strange, but the answer is actually right there in the TTFB CrUX documentation: “TTFB is only collected on full page loads, unlike LCP which is also collected on […] prerendered pages. The sample size of TTFB can thus be smaller than that of LCP and they may not necessarily be compared directly.” Put differently: CrUX TTFB and LCP currently use two different distributions; the former excluding prerendered pages, the latter including them.
What this means in practice, is that a bunch of the fast prerendered pages (very low TTFB) are suddenly simply removed from the TTFB population, leaving behind relatively more slow page loads in the distribution. This then causes the TTFB p75 to become higher than before (it is chosen from fewer, but slower page loads). This is different for LCP: it still has the same amount of measurements, now including many faster prerendered ones. As such, the LCP p75 can improve (it is chosen from the same amount, but generally faster pages).
You can probably predict why we didn’t have the same problem with our mPulse RUM data: there we simply DID include the prerendered pages in our TTFB distribution. As mPulse also uses option 2 by default, this predictably made its p75 TTFB improve in a similar fashion to its LCP.
Interesting insight: I talked about this discrepancy with Barry Pollard on the CrUX team. According to him, there isn’t a very strong reason for not including prerendered loads in the TTFB bucket; it’s simply how it was initially setup and they haven’t changed it due to competing priorities. They are thinking of changing that setup in the future, though they first want to consider all moving parts to make sure it’s the right change. They have also at multiple times solicited feedback from the community on this and there have been several interesting discussions about it in the webperf slack. Personally, I’m a bit on the fence 🙂 On one end, I’d like them to make the change to get increased consistency between the CrUX metric distributions. On the other, I think the current approach arguably makes their TTFB number more useful for getting a feel of “actual backend” problems in the wild. Luckily, I’m not the one who has to make these decisions.
In conclusion, the Speculation Rules API is a nice complement to 103 Early Hints in our discussion. Both shift what TTFB can mean if they’re used, and introduce new timestamps, but on different ends of the measurement span. In practice however, many tools (and their documentation) are likely not updated to take these new features into account, so make sure to double-check that when trying to assess their (TTFB) merits.
Soft Navigations API
A final topic I wanted to shortly touch on, is the fact that measuring various Web performance metrics, including TTFB but also certainly the Core Web Vitals, has been fundamentally broken for a long time for so-called “Single Page Apps” (SPAs).
This is because SPAs don’t really “load an HTML page” when you click a link. Instead, they will use a JS framework to intercept that click, fetch some data from the server, and then replace part(s) of the page with new content (I know this is heavily oversimplified, but it will suffice for this section ;)). This makes it difficult for the browser to know when this type of “soft” navigation has occurred (e.g., there is not always a change in the URL), and consequently it’s also tough to determine when/if a new NavigationTiming entry with a new startTime should be created. So tough in fact that, in practice until now, browsers have mostly refrained completely from trying to guesstimate what would constitute a “navigation” in an SPA.
As a consequence, SPAs typically only have 1 single NavigationTiming entry and startTime for an entire user session: that of the initial, “hard” page load. This also means they will just report 1 TTFB and 1 final LCP measurement, even if the user visited say 50 pages/screens/routes, which is obviously not ideal, as it hides many potential issues. This excellent article explains all these issues in more depth, as does this more general overview.
Luckily, help is coming! For a long time smart people have been working on a set of heuristics to try and determine if an SPA action represents an actual “soft” navigation, and should thus lead to a resetting of the NavigationTiming entry (and dependent metrics like TTFB and LCP). This is now reaching its final form as the “Soft Navigations API“, which is currently being trialed in Chromium.
While this is a very exciting new capability that will allow us to better/properly track the Core Web Vitals in SPAs, I bring this up here because it is currently unclear how exactly TTFB will be handled in the setup. The linked page mentions several options, from using the “TTFB of the first request made for the new page” to simply using 0 much like they currently “recommend for back/forward cache restores” (or, as we’ve seen above, can happen for speculation rules with activationStart). The first version of the new API will likely use the latter option, while “more precise TTFB measurements” might come in the future.
The end result is that I get to repeat myself here again: we have yet another different way of measuring/defining TTFB coming! Whoopie! 🙂 It’s actually even worse, as some RUM providers like mPulse, have had their own sets of heuristics for soft navigation tracking for years now, which are of course slightly different from the new, browser-supported ones. Wonderful! 🙂 Still, I of course think this is a net positive for the Web, as we currently do lack a ton of visibility into SPA performance.
Thoughtful note: conceptually, I would expect people are also already using custom metrics to track things like TTFB for their SPAs (maybe using ResourceTiming to get TTFB for the (first) JSON request that contains the data for the page changes? If such a request even exists). I don’t have enough experience with SPAs in practice though, but would like to hear from people who do how this is commonly tackled 🙂
So Much More
As I mentioned in the introduction, this blog post used to be much longer than it currently already is. This is because the above only covers a slice of all the many, many things that can impact TTFB, and I have written text on several more. I will leave the more exhaustive discussions of these technical nuances to later blog posts in this series, but to give a short overview already:
- DNS and Happy Eyeballs: DNS domain lookups go through various caching layers, so they can fluctuate heavily. What’s more, DNS lookups can return multiple server options for browsers to connect to (IPv4 vs IPv6, HTTP/2 vs HTTP/3), which leads browsers to “race” several connections to see which completes (first) in a process called Happy Eyeballs. However, how/if those “raced connections” show up in NavigationTiming is completely implementation dependent (read: different for every browser) and completely undocumented.
- 0-RTT: We’ve seen how responses can be early with 103 Early Hints, but requests can ALSO be early through 0-RTT (often also called Early Data). This can cause the
requestStarttimestamp to occur beforeconnectEnd, which should improve TTFB. However it can also lead to some weird edge cases when interpreting the measurements, as 0-RTT requests can be rejected by the server and then need to be retried by the client.
- HTTP/2 and HTTP/3 parallelism: H/2 and H/3 can easily request multiple things in parallel, but the server often can’t send all the responses in parallel due to bandwidth limitations. This leads to (seemingly) inflated TTFB measurements as
requestStartis the same for all requests, butresponseStartincreases incrementally the more resources there are on a page. This can be combatted by a dirty trick of sending the HTTP headers (way) ahead of the actual response, tricking TTFB but worsening TTLB.
- Gaps in the timestamps: At several points there can be (large) gaps between the NavigationTiming timestamps in Figure 1. There might for example be a pause after DNS resolution before the connection is actually established, or a waiting period while the browser queues requests before actually putting them on the wire. These gaps can be difficult to track and identify, often requiring special consideration (such as the UNO metric mentioned above).
- Critical Client Hints: When using Client Hints, the server can indicate some of them are critical, causing the browser to retry a request with those critical hints included. It’s still somewhat unclear to me how exactly that shows up in NavigationTiming.
- RTT measurements: Request TTFB is sometimes used as an analogue for network latency/round trip times (e.g., by Harry Roberts here). RTT is now also tracked as a separate measurement in CrUX. However, the latency/RTT of a connection is not a static thing… it can also often fluctuate heavily during the course of a connection, for example due to so-called bufferbloat (RIP Dave). As such, extra care needs to be taken to try and extract meaningful conclusions about network RTTs from (RUM) measurements.
- Network emulation/throttling accuracy: people often use various tools to emulate/throttle networks when performing synthetic tests. This will obviously impact TTFB in various ways, but the impact is often far from realistic/representative, even with popular tools like Chrome’s built-in network throttling or Google Lighthouse. Matt Zeunert recently released an excellent video about it that you really MUST see.
Note that even with these aspects included, this is a non-exhaustive list: these are mostly things that have come up during customer engagements or aspects I’ve wondered about while writing this article. There are still many more dragons out there.
Part 3: Where Does This Leave Us?
As should be clear by now, I’m not a particularly big fan of TTFB myself. I think it’s an overcomplicated, oversubscribed metric with way too many definitions to be very useful in practice. Making matters worse is that we keep adding new cool features to the Web platform, which in turn change how TTFB can be/is measured. I’d thus rather see TTFB replaced with several new (sub)metrics with different names and consistent definitions and usage, rather than continuing to inflate this current amalgamation.
I am however also not an unreasonable man (that sarcastic laughter you’re hearing in the background are my wife and longsword students). I understand why people seem to like the metric, and how it has gotten to this point. Sometimes, it’s simply convenient to have a single number as a high-level indicator. As Barry Pollard once said “TTFB is good for telling you something is wrong, just not so good at telling you what. […] It’s a good metric for differentiating between frontend and everything else.”.
I am also not a naive man (except that one time I thought Amazon would do well with Rings of Power). I know TTFB is probably here to stay and that getting people to use and define it consistently is a pipe dream. As such, I decided the best thing I could do is to help highlight some of the most common issues with the metric I’ve seen in practice.
The main goal of this series of blog posts is to have something that I/you/we can point our customers/question askers/them of little faith to and say “this specific thing is likely what we’re seeing here. Please go read up on it a bit first so we can start a further discussion from a common understanding” (as well as being usable as a general educational tool for budding web performance freaks aficionados, of course).
I am however also an overbearing man, and as such feel arrogant enough to also propose a few potential guidelines people can should MUST use when defining, documenting and using metrics such as TTFB:
Robin’s Recommendations for Carefree Metrics
- Document your interpretation and measurement methodology of the metric EXHAUSTIVELY: Go into extreme, ridiculous detail of both how you define the metric and how you measure it in practice (down to the API/function call level). Give concrete examples with numbers of what common measurements would look like and how you would interpret them. Explain how you handle edge cases and how they can be identified in the results. Explain WHY you decided on this particular approach. When it comes to documenting a metric, more is more.
- Take EXTREME care when comparing measurements: make sure you’re comparing apples to apples (or that you know and document the exact discrepancies). This includes the metric definitions but also the measurement executor (e.g., browsers vs synthetic), and the target being measured (different deployments). DO NOT make any assumptions about these apples, not even if they’re in the same basket (remember how the CrUX populations of TTFB and LCP can be quite different?). Do not rely on a single number/percentile/statistic; rather utilize and compare multiple different derivatives. Compare and plot as much of the underlying distribution as you can (remember Datasaurus!). When it comes to comparing things, it’s care before crisis.
- Collect and visualize ALL the data: do not just collect the single (compound) measurement, but rather include all possible individual subparts (as well as potential gaps between) (CrUX recently started doing this for LCP, and is exploring doing the same for TTFB 🥳). Allow tool users to easily filter, segment and group the data in a wide variety of ways (e.g., only show TTFB with a full connection setup vs only for prerendered pages, etc.). Provide ways of showing multiple different interpretations/definitions of the same data (e.g., Navigation, Connection and Request TTFB) and its component subparts in a single view. Provide ways to show raw data plots, distribution/histogram graphs, as well as high-level summary diagrams. When it comes to visualizing data, flexibility is the key to stability.
- NEVER try to hack a metric for the metric’s sake: always remember why the metric exists in the first place and follow the spirit, rather than the letter of the law. Don’t confuse the carrot (reward) for the actual purpose (moving that donkey). For Web performance, focus on actually improving end user experience. Always remember Goodhart’s law: “When a measure becomes a target, it ceases to be a good measure“. Don’t be afraid to change metric definitions/targets if they no longer make sense. When it comes to actually providing value, optimize for users, not dashboards.
If only everyone would simply follow these basic requirements, you wouldn’t have to read this type of overlong blog post ever again. Be the change you want to see in the world 😉
With that, we’ve come to the end. Welcome weary traveler and thank you for making it this far. Put up your legs and rest, you’ve earned it. While you’re here though, please let me know what you thought about this blog post. I’m very open to “constructive feedback” and to hearing some ideas on how we can improve this situation going forward (if the feedback is “make it shorter”, my poor fingers are way ahead of you there bud).
A big thank you to all the reviewers who provided feedback, especially Barry Pollard and Ryan Townsend and my colleagues at Akamai, particularly Tim Vereecke for broadly sharing his real-world findings from experiments on scalemates.com!
See you soon for Chapter Two, which will dig deep into several technologies and how they impact TTFB!