

JP Castro (@jphpsf) is a front end engineer living in San Francisco. He co-organizes the San Francisco performance meetup. When he's not talking about performance, he enjoys spending time with his family, the outdoors and craft beers.
Nowadays many websites employ real user monitoring tools such as New Relic or Gomez to measure performance of production applications. Those tools provide a great value by giving real time metrics and allow engineers to identify and address eventual performance bottlenecks.
This works well for live deployed applications, but what about a staged setup? Engineers might want to look at the performance before deploying to production, perhaps while going through a QA process. They may want to find possible performance regressions or make sure a new feature is fast. The staged setup could reside on a corporate network however restricting the use of RUM tools mentioned earlier.
And what about an application hosted in a firewalled environment? Not all web applications are publicly hosted on the Internet. Some are installed in private data centers for internal use only (think about an intranet type of setup).
How can you watch application performance in these types of scenarios? In this blog post, I’ll explain how we leveraged open source software to build our performance test suite.
Recording data
The initial step is to record data. For that purpose we use a bit of custom code that records time spent on multiple layers: front end, web tier, backend web services and database.
Our web tier is a traditional server side MVC application that generates an HTML page for the browser (we use PHP and the Zend Framework, but this could apply to any other technology stack). First, we store the time at which the server side script started, right before we invoke the MVC framework:
// store script start time in microseconds define('START_TIME', microtime(TRUE));
Secondly when the MVC framework is ready to buffer the page back to the browser, we insert some inline javascript code which includes:
- the captured start time (“request time”)
- the current time (“response time”)
- the total time spent doing backend calls (How do we know this information? Our web service client keeps track of the time spent doing webservice calls; and with each webservice response, the backend include the time spent doing database calls).
In addition to those metrics, we include some jquery code to capture:
- the document ready event time
- the window onload event time
- the time of the last click (which we store in a cookie for the next page load)
In other words, in in our HTML document (somewhere towards the end) we have a few lines of javascript that look like this:
<script>
Perf = Perf || {};
Perf.requestTime = <?= START_TIME ?>;
Perf.responseTime = <?= microtime(TRUE) ?>;
Perf.wsTime = <?= $wsTime ?>;
Perf.dbTime = <?= $soapTime ?>;
$(document).ready(function(){
  Perf.readyTime = new Date().getTime()/1000;
});
$(window).bind("load", function(){
  Perf.renderTime = new Date().getTime()/1000;
  Perf.clickTime = getLastClickTime();
});
$(window).bind("unload", function(){
  storeLastClickTime(new Date().getTime()/1000);
});
</script>
Finally we insert a couple more javascript lines in the head tag, so that we can record an approximate time at which the page was received by the browser. As Alois Reitbauer pointed out in Timing the Web, this is an approximation as it does not account for things like DNS lookups.
<head>
<script>
Perf = Perf || {};
Perf.receivedTime = new Date().getTime()/1000;
</script>
[...] more code [...]
</head>
Now that we have some metrics for a given request in the browser, how do we retrieve them so that we can examine them?
Collecting and analyzing the data
This is where Selenium comes into play. We use Selenium to simulate a person using our web application. Again this is technology agnostic as you can control Selenium from various languages (we use PHP and PHPUnit, but you could do the same with python or ruby).
Selenium has an API which you can call to invoke some javascript snippet and get back the output of the executed code. This API is called getEval.
Within our test code, we first open a page we want to analyze, then use the getEval API to retrieve the metrics we recorded and finish with storing the metrics for later consumption.
class ExampleSeleniumTest extends PHPUnit_Extensions_SeleniumTestCase
{
  public function testLoadSomePage()
  {
    // Open our web application
    $this->open('/');
    // Click a link to load the page we want to analyze
    $this->clickAndWait('Some Page')   // Use getEval API to retrieve the metrics we recorded
    $metrics = $this->getEval('window.Perf');
    // Call our internal method that will store the metrics for later use
    // Note: we include a reference to the page or to what use case we are testing
    $this->saveMetrics('some-page', $metrics);
  }
}
We use this pattern for multiple use cases in our application. Also note that while I used the example of a full page load, our framework also supports collecting metrics for AJAX interactions, which we do quite a lot (for instance remotely loading content triggered by a user click).
One of the great things about using Selenium is multiple browser support. We have a set of virtual machines running various versions of Internet Explorer and Firefox. This enables our performance test suite to run across multiple platforms.
The last piece of the puzzle is analyzing the data we collected. For this purpose we built a small database driven application which reads the metrics we collected and plot them. We can apply filters such as specific browser vendor or version, specific use case, specific version of our software, etc. We can then look at the complete data over time.
Here is the logic we use to plot the data we collected:
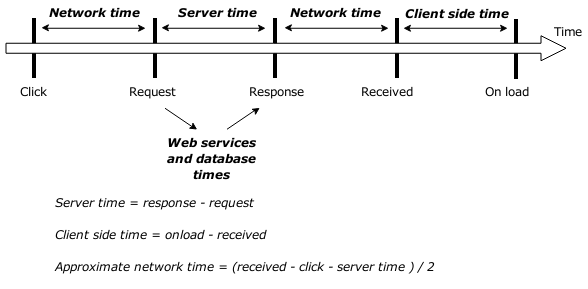
Sample results
This is an example of chart generated after collecting data:
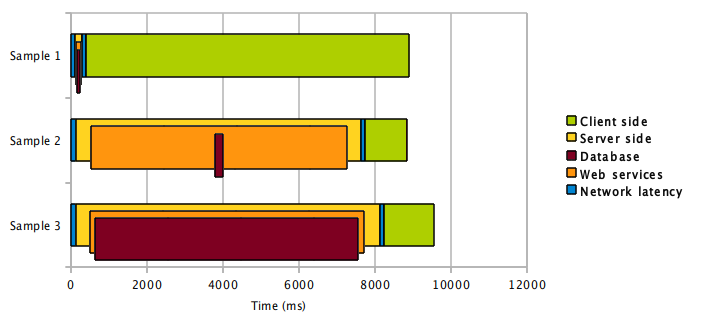
In the above sample, we can observe a client side performance issue in Sample 1, some inefficient code in the backend web services in Sample 2 and a slow database query in Sample 3.
Benefits
When we built this framework in 2009 we had multiple goals in mind:
- Monitor performance between our software release and catch eventual regressions
- Monitor performance of upcoming features
- Monitor the scalability of the software as we add more users/more data
Looking back, this tool yielded some great results and here are a few examples:
- Discovery of bugs in our javascript code that would result in much higher load times in IE
- Found issues in the way we were manipulating HTML with javascript and were able to improve the responsiveness of the impacted user interactions
- Eliminated bottlenecks in our backend web services as we raised the amount of data: we were able to pin point exactly where the problem was (inefficient backend code, slow database queries, etc.)
Closing words
In conclusion, I’d like to look into some ideas we have in mind to improve our setup.
I’d like to use the tool more often. We currently run the test suite several times during our development process and before each releases, but this is a manual process.
It would be great to tie in the test suite with our Jenkins CI builds. A different idea would be to ship the tool as part of our product and run it in production providing us with some analytics on real world usage of our platform.
As I mentioned, we are using virtual machines to test on multiple platforms. This adds a bit of overhead in terms of maintenance. Maybe we should look at the hosted Selenium solution from Sauce labs?
When we built the product, the performance landscape was a bit different and there are tools today that were not available back then. Would we see any benefits if we were to leverage Webpagetest, boomerang, etc.?
Credits
I’d like to acknowledge Bill Scott for his presentation on RUM at Netflix which inspired us to build our framework.