

Alois Reitbauer (@aloisreitbauer) works as Technology Strategist for dynaTrace software and heads the dynaTrace Center of Excellence. As a major contributor to dynaTrace Labs technology he influences the companies future technological direction. Besides his engineering work he supports Fortune 500 companies in implementing successful performance management.
Analyzing the loading behavior of web pages using browser plug-ins like YSlow, SpeedTracer or dynaTrace Ajax Edition has become really easy. As soon as we leave the browser the story however is a different one. Getting detailed data from real users is much harder and only possible to a certain level of granularity. The usual approach is to use synthetic monitoring and execute tests from a variety of points of presence as close to end users as possible. If you measure from many locations and cover most of your transactions this comes pretty close to what the users’ perceived performance. In case you are interested in more details on the pros and cons of using synthetic monitoring recommend this blog post.
The best way however to understand the performance from a user’s perspective is to measure in the actual browser. While this sounds very simple it turns out to rather be a challenge. Creating a waterfall chart like the one below by just using information available in the browser simply is impossible.
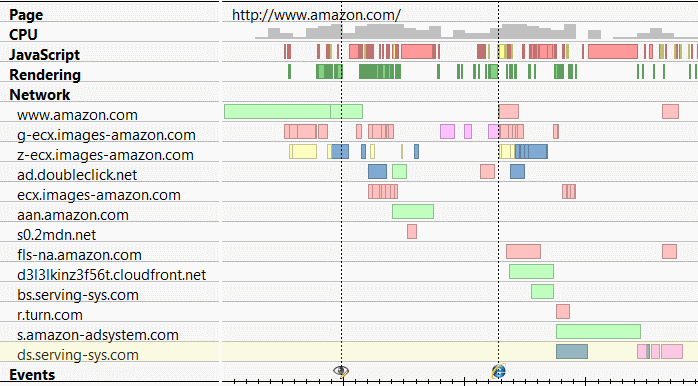
Waterfall Chart showing client activity in the browser
While there are free libraries like Boomerang and commercial products that can provide some of this information it tends to be pretty tough. Actually of the first question that comes up is one of the hardest to answer: How long does it take to load a page. Let’s be more precise here. How long does it take from the time a user initiates the loading of a page by clicking a link or typing a URL until the page is fully loaded. This – with some inaccuracies – is still doable for subsequent pages however impossible for start pages.
What however is already possible is today using a small portion of JavaScript as show below which will calculate the time from the beginning of the page until it is loaded. While this provides a hint on loading times we do not see DNS lookups, the establishment of connection or redirects. So these values might or might not reflect the load time perceived by the user.
<html>
  <head>
  <script>
    var start = new Date().getTime();
    function onLoad() {
       var now = new Date().getTime();
       var latency = now - start;
       alert("page loading time: " + latency);
     }
  </script>
  </head>
  <body onload="onLoad()">
  ...
Simple Script for Measuring Page Load Time
If we now go even further and also want to time resources on the page like images, css or JavaScript files it gets even harder. We could use a code snippet like the one below to get resource timings. The impact on the page load time as well as the effort for coding this behavior is significant.
...
<script>
  downloadStart("myimg");
</script>
<img src="./myimg.jpg" onload="downloadEnd('myimg')" />
...
Simple approach to time resources with significant impact on load behaviour
So it is really hard to get performance information from an end user perspective. However browsers have all this information. Wouldn’t it be the most natural thing for a browser to do expose it so that it can be easily accessed by JavaScript. This is what the W3C Web Performance Working Group is working on. The group is working on a set of standards which enable developers to get access to this data. Using the following short piece of JavaScript we can easily find out how long it took to load a page
<html>
<head>
<script>
function onLoad() {
  var now = new Date().getTime();
  var page_load_time = now - performance.timing.navigationStart;
  alert("User-perceived page loading time: " + page_load_time);
}

</script>
</head>
<body onload="onLoad()">
...
Using Navigation Timing to measure page load time
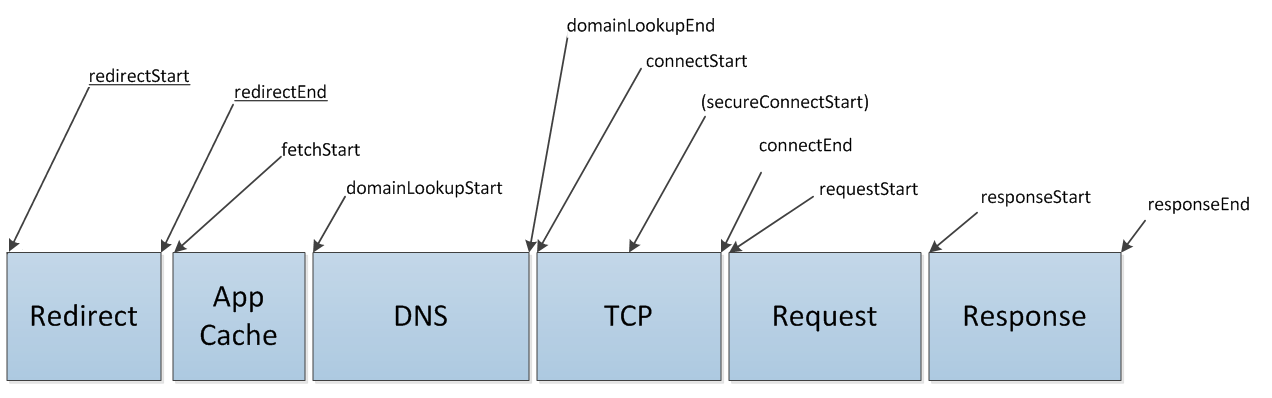
We can get even more details on the loading of a page to understand how long each “phase” of the page loading process took. As shown below we can find out how long it took to resolve the host name, establish a connection, send the request and wait for the response or how long it took to execute onLoad handlers.

Detailed timings provided by Navigation Timing
This functionality called Navigation Timing is already implemented in latest browser versions. On mobile, IE9 on Windows Mango already exposes this information as well.
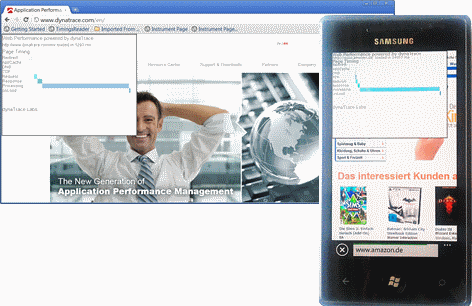
Using Navigation Timing in desktop and mobile browsers
While this is a great step forward we still lack a significant amount of details about page loading behavior. Most importantly we miss details about downloaded resources. Everything that happens between the start of the response and the onLoad event stays a black box.
Therefore the Resource Timing specification defines an interface to access detailed networking information about resources. Just as with the initial page we get the same granularity of information as for the main document.
Timings provided by resource timings
Unfortunately this spec is not yet implemented in current browsers but hopefully will be available with future browser version by somewhat mid next year. I think this is true at least for all the browsers that already implement Navigation Timing.
So this gives us great insight into the networking behavior of the application what we still miss however is the ability to time custom events on a page. Let’s look at a simple example. Assume we want to measure when certain content is visible on the page. This is where the User Timing specification comes into play. User Timing allows us to measure discrete points in time like how long it took from navigation start to the displaying of certain content on a page. The snippet below shows how this code might look like.
var perf = window.performance;
perf.measure("customLoad");
var customLoadTime = perf.getMeasures("customLoad")[0];
Measuring a custom point in page load using User Timing
So putting all this together we have a good way to time all major events that happen on a page. As using all these different APIs might end up being a bit confusing there will also be a common interface to access all this data. That’s what the Performance Timeline is about. The timeline provides a unified interface to access all performance related information
Conclusion
While they are not fully implemented yet the new W3C specifications for timing web pages provide an easy way to access performance information right in the user’s browsers. In future browser versions we will be able to drop a lot of the magic code used today to get end user timing information.
A question that however stays unanswered is how this data is sent back to the server. Currently there are two possible approaches. We can use beacons (HTTP GET request that piggyback the monitoring data) or XHRs. Both approaches work acceptably well in most cases; there are some issues with sending data in the onBeforeUnload event. So if we put everything together and add server-side infrastructure this is the data we can collect about our end users.
As a final sneak peak I can show you want level of granularity we will get using modern technology. The information below is collected by our own monitoring using a kind of “backport” of Navigation and Resource Timing into existing browsers.

End User based performance data for a blog page showing slow Third Parties
If you want to try it the new APIs today just follow this link and check how long it took to load this page. You can use this simple bookmarklet to get timing information for any page you are interested in.