

Tony Gentilcore (@tonygentilcore) is a software engineer at Google. He enjoys making the web faster and has recently added support for Web Timing and async scripts to Google Chrome/WebKit.
A wise engineer once said, “If you don’t have benchmarks for your system, you don’t actually care about its performance.†He added: “If you only have monitoring, then you must intend contributors to check in their changes first, and check for breakage later.â€
It’s no secret that benchmarking is key to improving performance and avoiding regressions. In order for a benchmark to be useful, it must be realistic and repeatable. Unfortunately, in benchmarking web page load times the variability introduced by the network often forces one to choose between including the network and dealing with noise, or zeroing the network and ignoring a dominating factor. In this post, I describe the creation of a page load benchmark for Google Chrome which simulates network time.
Why include the network?
The Chromium project continuously runs a number of page load time benchmarks. When a change causes a performance regression, the build tree is automatically closed to new changes until the regression is dealt with. This policy requires low noise benchmarks, so network time has effectively been zeroed out by loading resources from local disk.
This would work perfectly well if network time was a constant factor. But as anyone who has worked on web page optimization knows, it is far from it. Some of the most important performance improvements result from loading multiple resources in parallel, starting subresource loads earlier, and doing CPU work during the time that the client is blocked on the network.
Consider this hypothetical performance improvement which enabled two resources to be loaded in parallel.
Before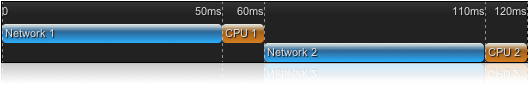
After
A 40% improvement: break open the champagne!
Now imagine what that same improvement looks like with network times zeroed.
Before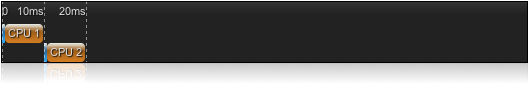
After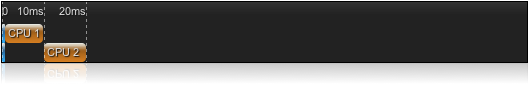
No improvement: guess we should look elsewhere.
Web Page Replay
With the goal of detecting these types of changes, Mike Belshe, Steve Lamm and I started the Web Page Replay project. A single cross platform script manages four components which act in concert to record and replay web pages:
- Record HTTP server for rapid creation of benchmarks. Incoming HTTP requests are forwarded to the real server and the responses returned to the client. At the same time, each request/response pair is stored in a map which is saved to disk.
- Replay HTTP server for low-variance replay of benchmarks. A previously recorded archive is loaded into memory where responses are looked up for each request. The real network is never accessed as only recorded responses are returned. Replaying under the SPDY protocol is supported even for pages recorded under HTTP.
- Traffic shaper for simulating desired bandwidth, round trip time, and packet loss over the loopback device. DummyNet serves this purpose perfectly since the recent porting effort has made it available on Linux, Mac, and Windows.
- DNS server for routing traffic to the local HTTP server. The system’s DNS settings are updated to point to this server which returns
127.0.0.1(loopback) for all name queries. While slightly more complicated than an explicit HTTP proxy, this setup both avoids lower concurrent connection limits for proxies and allows traffic shaping of DNS queries.
The trick to pristine replay
This system allowed simple web pages to quickly be recorded into benchmarks which may be played back with low noise. But many real world pages run JavaScript which affects the resources that are loaded (e.g., rotating ads). To ensure web pages always request the same resources, we inject a small script which stubs out the built in Date and Math.random implementations with deterministic implementations. With this hack in place, we haven’t yet found a web page which resists recording (including complex applications like Gmail).
When is the page complete?
The final challenge is to determine when the page load is complete. The ideal measurement would capture the point in time when all content in the visible portion of the window is rendered and interactive. However, this subjective measure has so far defied a generic implementation. The most common approximation is the window’s load event, but that fails in two main cases:
- Long pages with content below the visible portion of the window fire the load event too late.
- Dynamic pages with asynchronously loaded content fire the load event too early.
Since our benchmark is aimed at the browser, we decided to live with the problem of the load event firing too late. Including too much work gives us a larger surface area to optimize.
But dynamic page problem turned out to be more tricky. We couldn’t just ignore it because not only did it result in a less-than-ideal marker, it also introduced noise. Some pages like the google.com homepage have asynchronous JavaScript that races against the load event to begin a resource download. When the resource starts in time, the load event includes the time to download resource. But when it is slightly later, it does not.
At first, using the last paint event seems like a logical choice. But too many web pages have animations or videos that fire paint events forever. Another option is the first paint event, but this turned out to avoid the bulk of the page load time for most web sites. Finally, we eliminated this last bit of variance by introducing a new metric, Last Load Time: the latest load event for any resource on the page.
var lastLoadTime = 0, previousLastLoadTime = 0;
function checkForLastLoad() {
  if (lastLoadTime > previousLastLoadTime) {
    previousLastLoadTime = lastLoadTime;
    setTimeout(checkForLastLoad, 2000);
  } else {
    console.log('Last Load Time: ' + lastLoadTime);
  }
}
window.addEventListener('load', function() {
  lastLoadTime = new Date();
  checkForLastLoad();
}, true);
document.addEventListener('load', function() {
  lastLoadTime = new Date();
}, true);
Takeaway
Now we have a much more realistic harness for creating and running low noise page load benchmarks. This helps us to ensure each new release of Chrome is the fastest ever. You may find Web Page Replay useful in your benchmarking, for mocking out backends, or just as a quick way to see how much faster your site would load under SPDY. In any case, I hope this post has encouraged you to benchmark your application.