Joshua Bixby (@JoshuaBixby) - by day, president of Strangeloop, a company that designs and implements site acceleration solutions. By night, he mines data about web performance and its impact on users.
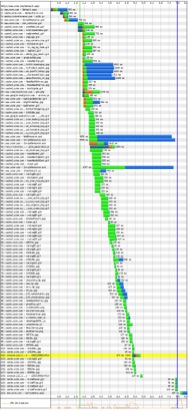
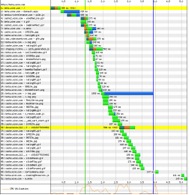
Both of these waterfall graphs come from the same landing page for the same ecommerce site. One is optimized, and one is not. Which waterfall led to greater revenues?
| Waterfall A | Waterfall B |
|---|---|
 |
 |
Vote for which waterfall you think is faster, and then get a detailed breakdown of how each one performed.
Shorter waterfalls = leaner pages
Leaner pages = faster websites
Faster websites = more revenue
This post is intended as a real-world cautionary tale about two things:
- Optimizing isolated pages, out of the context of their place in a user’s flow through your site, is not the same as improving performance.
- A single waterfall viewed in isolation is not enough to indicate overall site success.
The back story
A couple of months ago, I was approached by an ecommerce customer with a problem that was perplexing to them. In the previous six months, they had undertaken a massive effort to improve site performance and had dramatically improved YSlow/Page Speed scores on their key pages. They were proud of the resulting waterfalls and had seen immediate speed improvements in the key landing pages.
Waterfall B is from one of those landing pages. As you can see, it’s a beauty: lean and mean, with just 36 page objects and a load time of 3.485 seconds. This was a huge improvement over the previous version of the landing page, Waterfall A, which contained 113 objects and took 7.453 seconds to load. Victory!
But this victory was short-lived. They put in place an A/B test (they split the site’s traffic, so that 35% of visitors were getting the accelerated pages and 65% were getting the unaccelerated pages) to highlight the business value of optimization, with a goal of using the test results to convince management to increase the performance optimization budget. But they quickly realized that revenue and conversions were hurting. The A/B test revealed that both conversion and revenue decreased for the supposedly accelerated traffic. In fact, the company lost almost $15,000 per day during the test run.

They immediately reverted the new pages to the old ones and called me.
Let’s collect data
Instead of speculating or trying to approximate user behavior using synthetic tests, the first thing we did was actually measure real world behavior. We asked the customer to drop javascript into every page, which would radio back exact browser load times for every user. Doing this would let us see what was happening in the real world. We redid the A/B test with the measurement tools in place and undertook an extensive data analysis project. We found a very disturbing trend.

What we saw was that the optimizations were helping the first page in a user’s flow, but each subsequent page after that was being degraded in terms of performance. As the graph above shows, each step a user took into the site was slower after the first page.
Before we get into that, a brief but necessary digression…
Flow: Not just an annoying yoga term
The simplest definition of website traffic flow is this: the paths that visitors take through a website, from entry to exit. While of course there’s no single path for all users, we accept that there are some commonalities. For example, visitor comes to home page, uses search to find a product, locates product, adds it to their cart, then checks out. There are shortcuts (e.g. visitor uses Google to search for a product, and Google parachutes them to a specific product page) and abandoned paths (e.g. visitor doesn’t complete the transaction for whatever reason), but these truncated paths still exist within a longer flow.
All of this is probably a rehash of what you already know, but still, it’s surprisingly easy to forget this when you’re fully immersed in performance tuning. It’s easy to get caught up in the granular tasks involved in fixing individual pages and lose sight of the bigger performance picture.
So what does flow have to do with this story?
When looking at the fully optimized pages, we saw that they were designed to get great YSlow/Page Speed scores but lacked any concept of flow.
The culprits: lack of context and misuse of consolidation.
We analyzed the objects for each of the affected pages and realized that, while the landing page was properly optimized in the technical sense, the objects were poorly consolidated in terms of how they related to the rest of the pages in the flow. Basically, they were consolidating objects into a single, efficient package that would give them great YSlow/Page Speed scores but would require additional downloads on subsequent pages. This technique looks great in a waterfall and performs well on a per-page synthetic test basis, but as we see in this example, can really hurt overall performance and, in the end, revenue.
Conclusions
Looking at individual waterfalls can be misleading and give you a “false positive” result. Well-optimized landing pages, as judged exclusively by tools like YSlow and Page Speed, are not good enough, and can even inadvertently harm revenues. You need to take a whole-site approach to optimization. This mean developing a deep understanding of your traffic flows so that you can ensure that all pages are optimized for peak user experience.
And finally, you need to constantly monitor performance – in terms of page speed AND conversion/revenues/whatever bottom-line metric is important to your organization – to make sure that site performance and business metrics are aligned.
