

Stoyan (@stoyanstefanov) is a Facebook engineer, former Yahoo!, writer ("JavaScript Patterns", "Object-Oriented JavaScript"), speaker (JSConf, Velocity, Fronteers), toolmaker (Smush.it, YSlow 2.0) and a guitar hero wannabe.
Ladies and gentlemen, boys and girls. Say hello to icy.
icy
It’s an iOS app that lets you debug HTTP. It’s like HTTPWatch or WebPagetest but for mobile. Like blaze.io’s mobitest but in your pocket, works with 3G, Edge (as these can have different characteristics and carrier optimizations than Wifi) and also lets you inspect pages behind login.
Some details
- It’s a
UIWebViewthat loads the page you want and provides aNSURLCacheclass which logs whatever the iOS networking layer throws at it. - It’s on github. Note that this is my very first attempt at iOS and Obj-C so the code quality is probably atrocious. License is public domain, because I don’t really understand the others
- The name is
icy, because it’s iOS and it’s the law that app names be prefixed with an “i”. Also (to my Eastern European ear at least), “icy” sounds like “I see” (spelled “ic” in chats) and is the beginning of (said with spookiest of voices) “I see… HTTPeee”
Walkthrough
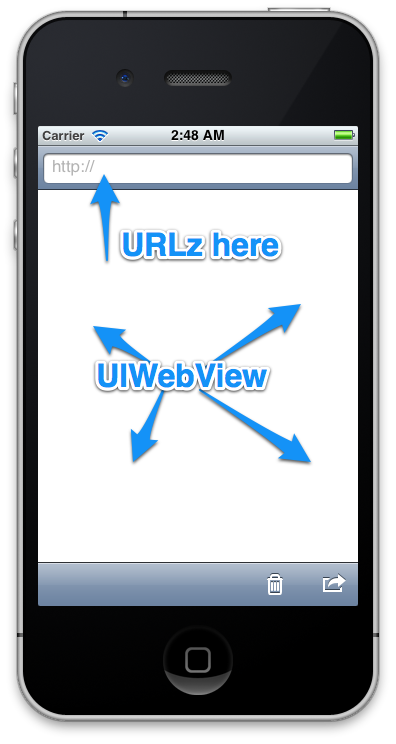
A journey of a thousands miles begins with a single tap. As you can see the icon is the default/missing icon. (Who cares about icons?) If you focus hard enough you may convince yourself that the white icon actually makes sense, it’s like snow, or, there you have it, ice.
![]()
What we have here is a UIWebView waiting to load a page and an address bar. Right there you already see the first problem with the app – UIWebView is not really iOS Safari. It may act differently and even have a different JavaScript engine. But it’s as close as we can get.
Tapping, typing, tapping, typing…
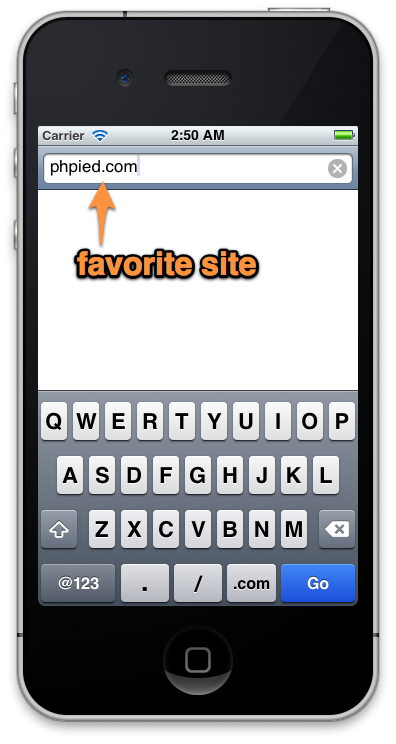
Oh look, a page is loaded! Now let’s remove the veil and peek to see what’s underneath all that fancyness.
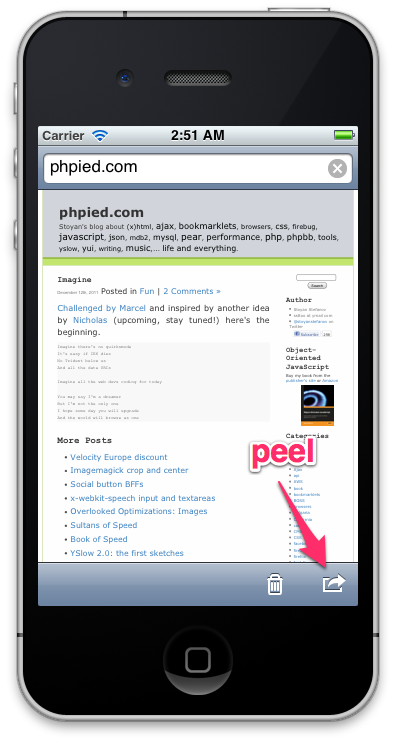
Ha! Requests!
As you can see I stole the JS/CSS/HTML icons from the webkit project. And if a page component looks like an image (has Content-Type: image/*), you see a little thumbnail.
You see the number of requests that this page made.
Also each request line is a link to more details.
The details are split into “Meta”, “Request headers” and “Response Headers”. Meta contains general info like URL and duration.
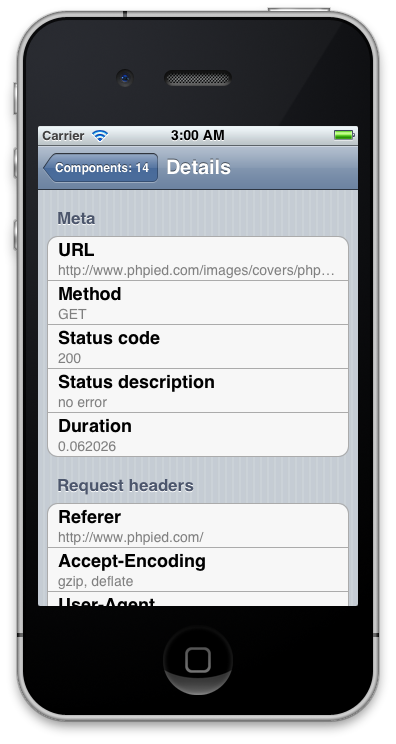
“But is the duration accurate?” You may ask as a critical reader and a performance geek. To the best of my knowledge it’s pretty accurate. I think a more under the hood post is due to talk a bit about the internals.
Request headers, as we know and love them.
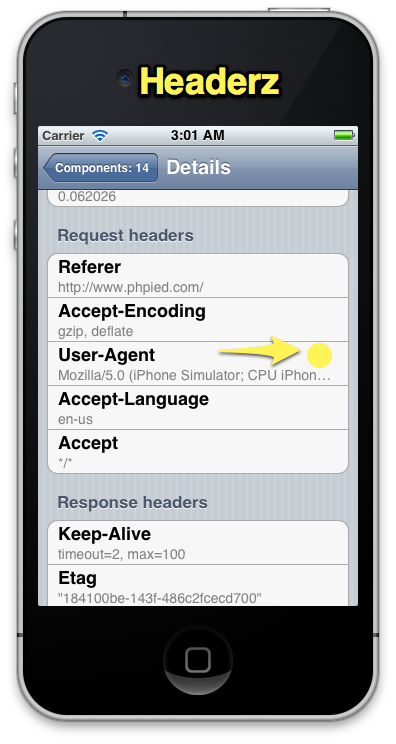
If the text is cut off, you can tap again and get the full text of the header value.

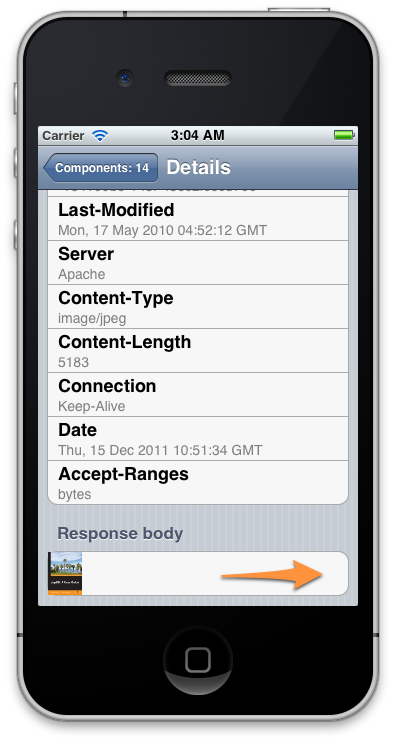
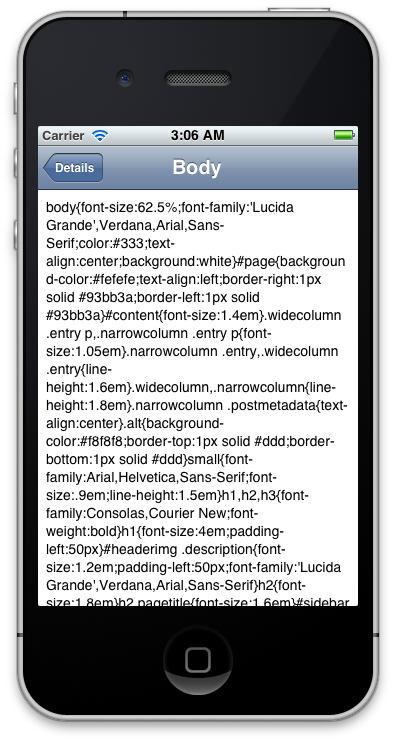
After request/response headers, what we have is a preview of what the component looks like. If it’s an image you get a little thumb which you can click to get a bigger image.

If the component is text you get the first few characters and then tap for the real deal.
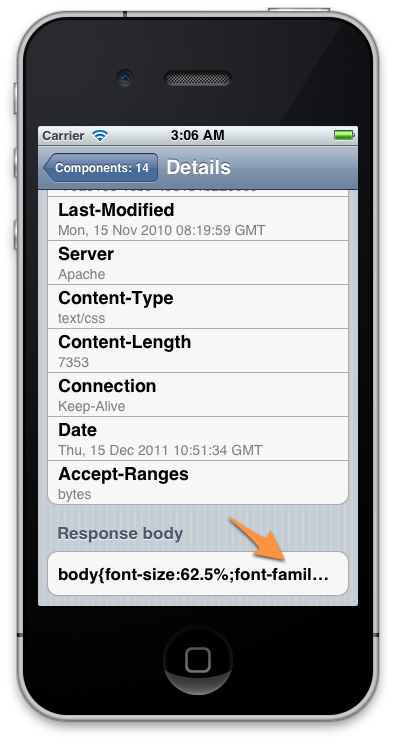
And that’s all there is for now.
Todos
There are a few immediate todos (for which I’d gladly take any help) and some more general ideas for going forward.
First of all – is the NSURLCache the best/only way to inspect the network? At first I was a little disappointed that the iOS SDK doesn’t provide APIs to inspect the traffic. But then I saw what Patrick Meenan needs to do to make WebPagetest happen, so I guess a little hacking and method swizzling might be appropriate. Which would lower the chances of the app ever hitting the app store maybe though.
Anyway NSURLCache is a way to implement your own caching in your native/hybrid app. Which in and of itself is a nice optimization to know about when building iOS apps. You create a class extending NSURLCache and announce it:
[NSURLCachesetSharedURLCache:mycache];
And then every time the web view is about to make a request it will ask your class “hey, got that google.com/logo.png thing?”. And also every time a component is downloaded, it will be passed to your class so you can store it.
And this is how the icy app was build, only instead of storing and returning files, I just log anything that comes my way.
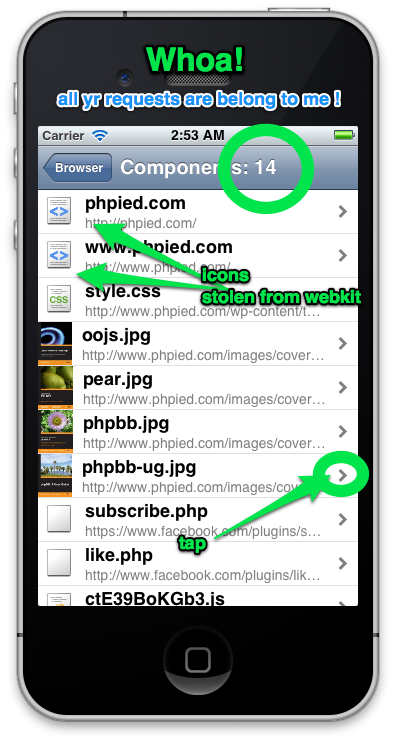
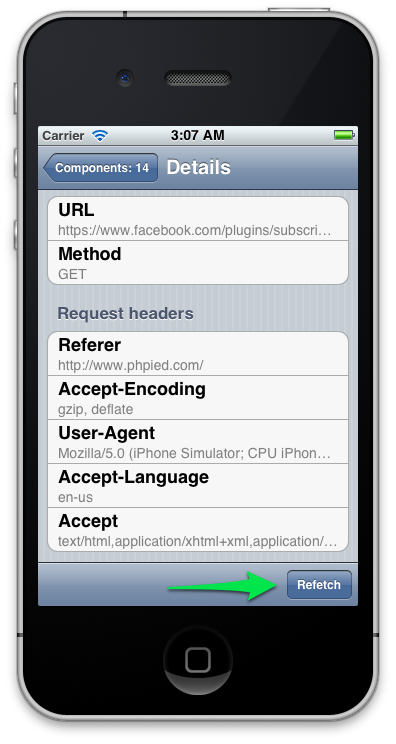
And this “anything that comes my way” is where incompleteness of introspection comes. Sometimes the networking layer doesn’t call my method to say that a new response has arrived. Responses that are thought of uncacheable may never reach my NSURLCache child. In these cases you see in the app that I got the request, but no response for it to match. In the example below it’s the PHP for Facebook’s Like button. The white icon means I didn’t get a Content-Type response header to inspect

That’s why I thought a refetch might be a good idea for inspecting URLs that we didn’t get a response for. We can make a separate deliberate request and get the response, we don’t rely on the NSURLCache and UIWebView. That’s the idea and it’s a todo currently.
The other thing is clearing the log. That’s easy, but clearing the cache didn’t prove to be so easy. I swear I did it at some point and it was working (I had to destroy the UIWebView to make it work) but then I changed something else and it stopped working. The change I suspect is when I deleted the .xib/.nib file I originally had for the UIWebView.
![]()
The road ahead
The road ahead is around HAR.
As you can see we can look at requests/responses, but it would be nice also to have things like a yslow score, page speed score, potential wins of minification, etc. A bunch of tools. My idea is to separate the tools of performance intelligence from the mechanics of collecting the raw data. And the glue is HAR.
We have the online HAR viewer so no need to build waterfall diagrams, just pass it a HAR file.
We now have YSlow command-line which will be a question of time to get a Web UI going. It should accept a HAR and run all the YSlow intelligence on it. Same for PageSpeed. I shouldn’t have to integrate all tools in icy but rather have icy open Safari, point to a URL of a tool and pass it a HAR. Needless to say tool URLs should be configurable so you can run your own, even in-house, tools.
What icy can help address is the visibility into the UIWebView. Just getting the best data possible, creating a HAR and passing it on. This is what I call the mechanics of gathering the raw data, the “it is what it is” data. As opposed to the intelligence of tools like YSlow that can answer the question: “I have this page here, so what next”.
And I’m hoping we, the web performance community, will have these little lightweight “agents” on every possible device that makes network requests, so we can gather the raw HTTP data and pass it to the good old tools for their opinions. We also need to know what possible optimizations carriers do. So…
All I want for Christmas…
… is more tools. We can only improve what we know about. Therefore visibility into what’s going on is critical.
This little icy app is just an example, sort of saying to manufacturers, phone builders, browser vendors – here’s what we want, now gimme!