

Peter Hedenskog (@soulislove) works at Cybercom in Stockholm, Sweden. He likes soulful music and building tools (checkout sitespeed.io, JDBCMetrics and BrowserTime).

Tobias Lidskog (@tobiaslidskog) is passionate about web performance and empowering developers with great tooling. He's located in Stockholm, and is currently working on payment solutions at Seamless. Most recently he's been contributing to the development of BrowserTime.
In last years Performance Calendar Marcel Duran told us how to make Proactive Web Performance Optimization, meaning how can we make sure our sites are as fast as possible before a new version is released. In this year calendar Maciej Brencz showed us how to integrate phantomas in your continuous integration. And earlier this year Etsy open sourced the wpt-script.
Web performance and continuous integration is hot and very much needed. We wanted something that is easy to setup & run so we built a Jenkins plugin. A Christmas gift to ourselves to keep track our own projects and hopefully it can help others too.
Ok, so are you ready, here’s the new plugin … BOOOM!!!
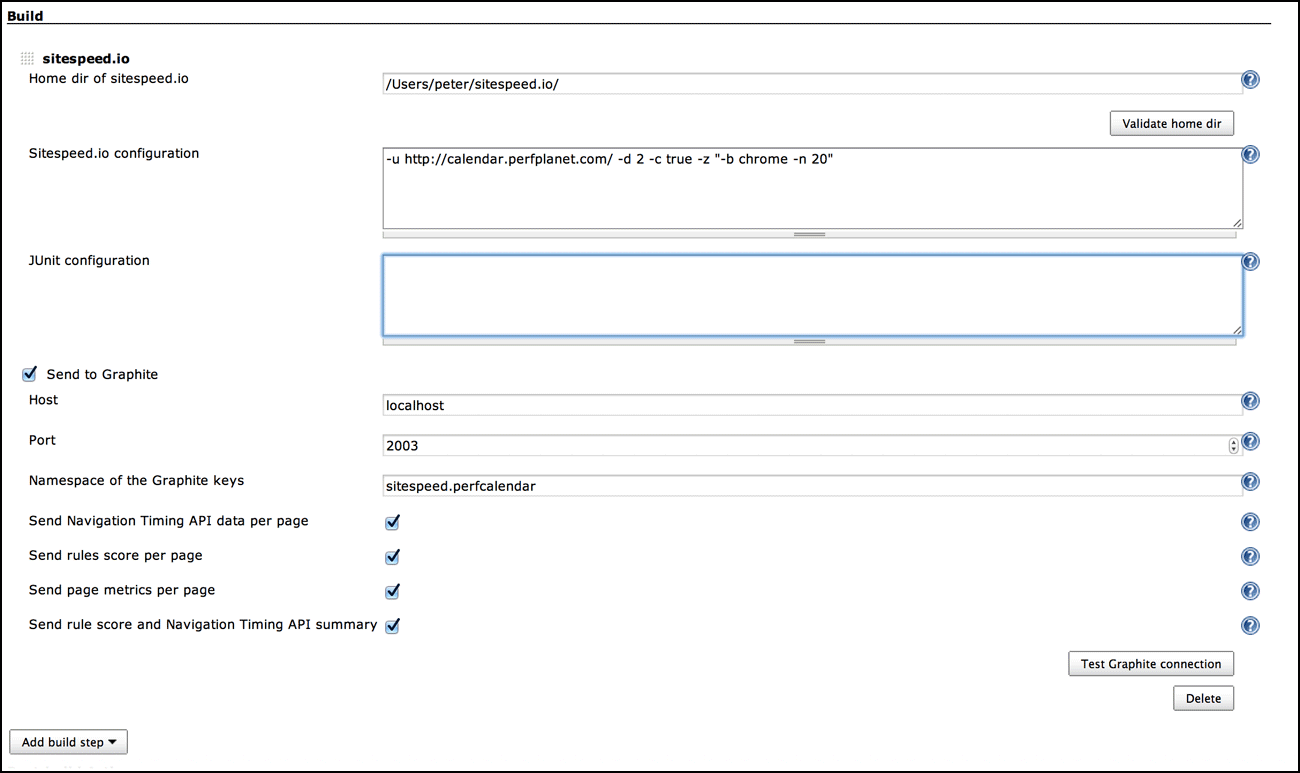
Hmm, ok, it doesn’t look much but it actually do quite cool things. The plugin will match your site against web performance best practice rules, fetch timing metrics from a browser using the Navigation Timing API (and User Timings) and send all the metrics to Graphite.
Background
The Plugin uses sitespeed.io and BrowserTime to analyze & collect the metrics. Both tools are open source and available on GitHub. What is extra cool is that the plugin can use every functionality within the two tools, so for example you can either choose to crawl the site or test specific URL:s in a list. And when collecting timing metrics you can choose browser (as long as it support the Navigation Timing API) and how many times it will access the page, meaning you can test your page 30 times if you want. You can see all the options here.
Match your site against the rules
Steve Souders old classic best practice web performance rules are still valid and you can use the plugin to test your site against those and newer ones like single point of failure (SPOF) and minimizing the rendering path. There are a total of 30+ rules. There is one set of rules for desktop and another for mobile. The rules follow the same pattern as YSlow: you get a maximum score of 100 per rule and the tool will report your overall score for all tested pages.
Time your favorite browser
Performance has become a focus area for all major browsers in the last few years. Improvements to developer tools, and new W3C specifications has also given developers a much more insight into what’s going on under the hood as web pages are rendered. This allows us to collect network and rendering metrics from browsers and include in our performance test work flow.
Browsertime is a command line tool that uses Selenium to get metrics from the Navigation Timing and User Timing javascript APIs. Chrome, Firefox and IE already supports these, and more browsers will hopefully follow. Time stamps are collected for standard rendering events such as 'responseEnd', 'domInteractive', 'loadEventStart', as well as timing marks logged by the page, e.g. 'performance.mark("myCustomMark")' . Browsertime will also report interesting intervals, such as the 'serverResponseTime', 'pageDownloadTime', 'pageLoadTime' used by Google Analytics, plus a few of its own. Naming a custom mark so that it ends with a 'Time' e.g 'aboveTheFoldTime' will make sure that the mark ends up in the summary fields in the plugin.
For more reliable results, run each URL a number of times in a row, and Browsertime will calculate medians and percentiles of timing values. Data can be outputted as either JSON or XML from Browsertime, with the plugin it just works out of the box.
Break builds
One thing you want to do is to break builds if one of your pages are too slow or violate one important rule that can cause slow paged for the end user. That works easy with Jenkins because the plugin will output JUnit XML for both the rules and the timings, so you only need to add a post build action to publish the reports.
You can setup your own limits for when to break the build. Break the build based on either your overall score or a specific rule. You can also configure to skip specific rules. Since the rule system is using YSlow you can easily compile your own set of rules if needed. Break the build if timing metrics don’t meet your goal. You can set limits for all different timings reported by the Navigation Timing API, your own User Timings and browser specific metrics, such as firstPaintTime for Chrome. You can create default limits (meaning these limits must be met by all tested pages) or specific limits per URL.
Extra extra: Send your webperf metrics to Graphite
You can choose to send the webperf metrics to your Graphite server. You have four different types you can send and you can individually choose which ones.
- Rule score per page – send the rule score for each rule and individual page.
- Timing metrics per page – the median and percentiles of all the intervals like domContentLoadedTime per page.
- Page Metrics per page – number of hosts, number of assets per type (js/css/images etc) and the size per type.
- Site summary – a summary for all pages of the rules score and the Timing metrics reported with median and different percentiles.
Feedback please
The Jenkins plugin can be downloaded from GitHub (it is not yet included in the weekly Jenkins releases, that’s on the to-do list). Browsertime is also found on GitHub. Give your feedback by opening issues for Browsertime and the Jenkins plugin. Both projects are still very young so try them today, tell us what to work on next and help make the web better!