The following is an excerpt from Chapter 8 of Designing for Performance, “Changing Culture at Your Organization”. This O’Reilly book is currently available as an early release, and you can pre-order the print version to ship on December 15!
Page speed is a relatively intangible problem. Though it’s easy to get numbers around it, performance is mostly about perception and feeling. Total load time and frames per second don’t easily communicate to people why they should care about making improvements; problems that are less tangible like this often need a champion within an organization who comes from a place of power. Very Important People who care about performance will help you dramatically shape your organization’s culture.
To emphasize the importance of performance upward, focus on showcasing it both within business metrics and with end user experience. The first angle involves numbers: impact on conversion rate, total revenue, returning visitors. The second angle focuses on helping these VIPs feel how slow your site is and empathize with your end users.
Impact on business metrics
There are plenty of studies across the Internet that demonstrate the business metric impact of performance:
- Akamai has reported that 75% of online shoppers who experience an issue such as a site freezing, crashing, taking too long to load, or having a convoluted checkout process will not buy from that site.
- Gomez studied online shopper behavior and found that 88% of online consumers are less likely to return to a site after a bad experience. The same study found that “at peak traffic times, more than 75% of online consumers left for a competitor’s site rather than suffer delays.’
- Users will return to faster sites, as evidenced in a study by Google that noted a decrease in searches for users who experienced a site slowdown.
- DoubleClick, a Google ad product, removed one client-side redirect and saw a 12% increase in click-through rate on mobile devices.
Identify what kinds of numbers your upper management cares about. Is it revenue? Membership? Social media engagement? Once you figure out which metrics matter to them, find and share performance research with them that relates to those particular metrics. Correlate engagement metrics (such as bounce rate, click-through rate, and returning visitors) with revenue and other bottom-line metrics that resonate with this audience. Each organization and its VIPs have defined business drivers to which you can draw parallels from these studies.
If possible, run experiments on your own site to correlate performance improvements to the metrics these folks care about and share them alongside the other public research. While big sites like Amazon and Google can run slow-down experiments to measure the impact that a slower site has on its users, your organization probably won’t like the idea of you intentionally slowing down the site just to see what happens. Focus on finding high-impact quick performance wins, like compressing images or implementing better caching.
Make one significant improvement and measure its engagement metric impact. If possible, run an A/B test to compare your audience’s behavior in the control to your new, improved variant. If you’re able to move the needle on revenue-related metrics like conversion rate, terrific; if not, focus on other engagement metrics like bounces and pages per visit. Tie any statistically significant improvements in your new high-performing version to the metrics that upper management cares about. A lower exit rate, for example, could mean more users choosing you over a competitor or returning to search engine results.
If you’re unable to run an A/B test, measure engagement metrics before you make the improvement and again afterward. It won’t be scientific, but it’ll be the best case you can make to upper management. Read more about measuring the impact of performance improvements in Chapter 6. Share the work you did and the resulting business metric changes with those VIPs to help them understand the impact that performance work can have.
As you make any performance changes, also measure how long it takes you to do so. Design and development hours are a cost for the business, and you’ll need to address this as you work on turning VIPs into champions of your cause. Find the quickest and most impactful wins possible to start to emphasize that improving the user experience doesn’t have to be a large cost to the business. Translating a specific number of resource and development hours into a revenue win for the business will be your biggest asset in the conversation, and will help you continue to get support as larger and more time-intensive performance work is needed.
Conversations with upper management should include a blend of public research from around the Internet, research that you’ve done on your own site, as well as the cost of this kind of work to the business. A holistic approach to these conversations should be grounded in an understanding of which engagement metrics and business factors resonate the most with your internal audience.
Experiencing site speed
Helping upper management understand what your users are experiencing on your site is key. We can talk numbers all day, but getting to the root of how your performance affects your users will require you to focus on your site’s user experience. Remember that most people within your organization are probably accessing your site on newer hardware with fast connections and are probably relatively close to your datacenter. How do people around the globe experience your site? How do people experience your site when they’re not on a desktop computer?
Run multiple WebPagetests using different locations and devices and compare the results. You can compile all of the results into a single filmstrip view to compare them using this URL structure: webpagetest.org/video/compare.php?tests=<Test 1 ID>,<Test 2 ID>…
For example, in Figure 1 I ran three separate tests for the Huffington Post‘s site: one using the Virginia test location using Chrome on a desktop, one using Internet Explorer 8 from the Singapore location, and one using Chrome on an Android phone from the Virginia location. While the overall numbers varied widely for each test and could make a compelling argument for mobile and global performance improvement needs, the filmstrip view really helps you feel the difference in user experience.

Figure 1. WebPagetest provides a filmstrip view as well as video for you to compare tests at the same time. This helps give you a better understanding and feel for the performance of these sites.
Another angle to consider during these conversations is pride. While revenue impact is a great metric you can use to convince upper management that performance should be an important consideration for any designer and developer at your organization, it’s not the only tool in your tool belt. Your site likely has competitors. How do their page load times compare?
WebPagetest also allows you to compare multiple URLs before you begin a test for a visual comparison of performance (see Figure 2). All of these tests in the Visual Comparison tool will use the Dulles, Virginia, testing location.

Figure 2. You can enter multiple URLs into WebPagetest to compare their performance.
Once the tests complete, WebPagetest can show you a filmstrip view of how each page loads over time, as shown in Figure 3. You can even export a video of the page loads in tandem; this really helps people feel the difference of how the sites are loading. You’re able to avoid numbers altogether, instead focusing on gaining an understanding of how your users are experiencing your site and your competitor’s site in the same time frame.
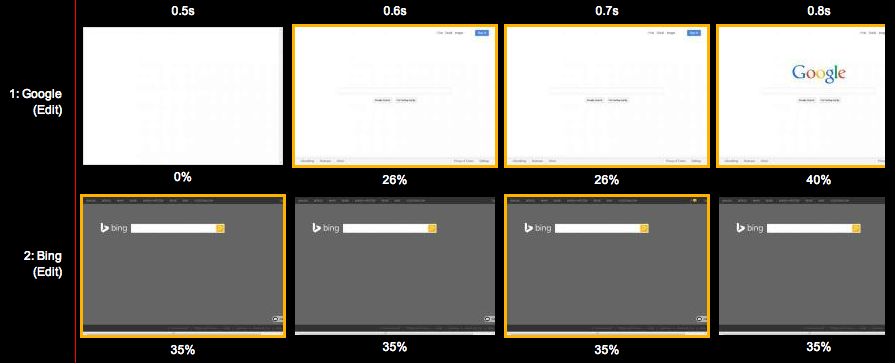
Figure 3. Use WebPagetest’s filmstrip view and video comparison to gain a better understanding and compare the performance feel of different sites.
Page speed and user experience are not secrets. Any of your competitors can test your site, or run it through performance tools and see how you’re stacking up. Remind the Very Important People in your organization that you are being analyzed not just by your users, but by your competitors, too. Be sure that you are outperforming your competitors’ sites.
One last way to utilize the filmstrip and video views is to compare the before and after of a performance improvement you make to your site. While measuring the impact that the improvement had on engagement metrics is powerful, it can be equally helpful to document the visual of how differently the site loads, particularly if your improvement helps perceived performance rather than total page load time.
Use these tools during your conversations with upper management to help make the case that everyone at your organization has an impact on the end user experience and should focus on performance as part of their daily work. A site that feels fast requires everyone who affects the user experience to keep performance top-of-mind during their daily workflows.
Designing for Performance by Lara Callender Hogan
http://shop.oreilly.com/product/0636920033578.do
ISBN 978-1-4919-0251-6
Copyright 2014 O’Reilly Media, Inc. All right reserved. Used with permission.