

Two of my favorite new things in sitespeed.io 3.0 are the ability to drive WebPageTest (done using Marcel Duran’s lovely WebPageTest API wrapper) and send the metrics to Graphite. I like it a lot because it simplifies my day to day by keeping track of the performance of the sites I work with.
What you need
To get it up and running you need to install a couple of things.
- Install sitespeed.io –
npm install -g sitespeed.io - Install your private WebPageTest instance (follow Pat Meenans instructions) or use the public version with a API key
- Install Graphite (the storage for the metrics) – yep, Graphite is a little pain to install, so use a version using Vagrant or let the devops people help you
- Grafana (a nice looking frontend for Graphite) – download from grafana.org
Collect the metrics
Create a text file with the URL:s you want to test, one URL on each row.
http://www.sitespeed.io
http://www.sitespeed.io/documentation/
Run sitespeed.io and send the data to Graphite (make sure you run it as often as you need):
sitespeed.io \
  -f urls.txt \
  --wptHost my.wpt.org \
  --graphiteHost your.graphitehost.com \
  --graphiteNamespace dulles.chrome \
  -n 9
Setup the host for WebPageTest (use --wptKey if you run on the public instance) and Graphite. Use -n to change the number of times you will test each page. If you have a private instance, this should be a high and odd number.
The graphiteNamespace is the first part of all the keys sent to Graphite. I usually use the location and the browser, so you can test from multiple locations
with different browsers and graph them in the same graph.
Setup the graphs
When the first values have beed sent to Graphite, you have all the keys so you can configure
the graphs in Grafana. You have metrics both for individual pages and for a summary of all tested pages.
Setting up a metric in Grafana looks like this:

You can graph time to first byte, first paint, speed index, load time, visual complete and User Timings (all user timings you have on your pages will automatically end up in Graphite).
For each metric you choose between which value to use: min, p10, median, p90, p99 or the max value.
And this is what you get
In this example I’ve setup a dashboard containing the Speed Index for first and repeated view and then graph all timings per view. You can also see the two User Timings (logoTime and headerTime) in the graphs.

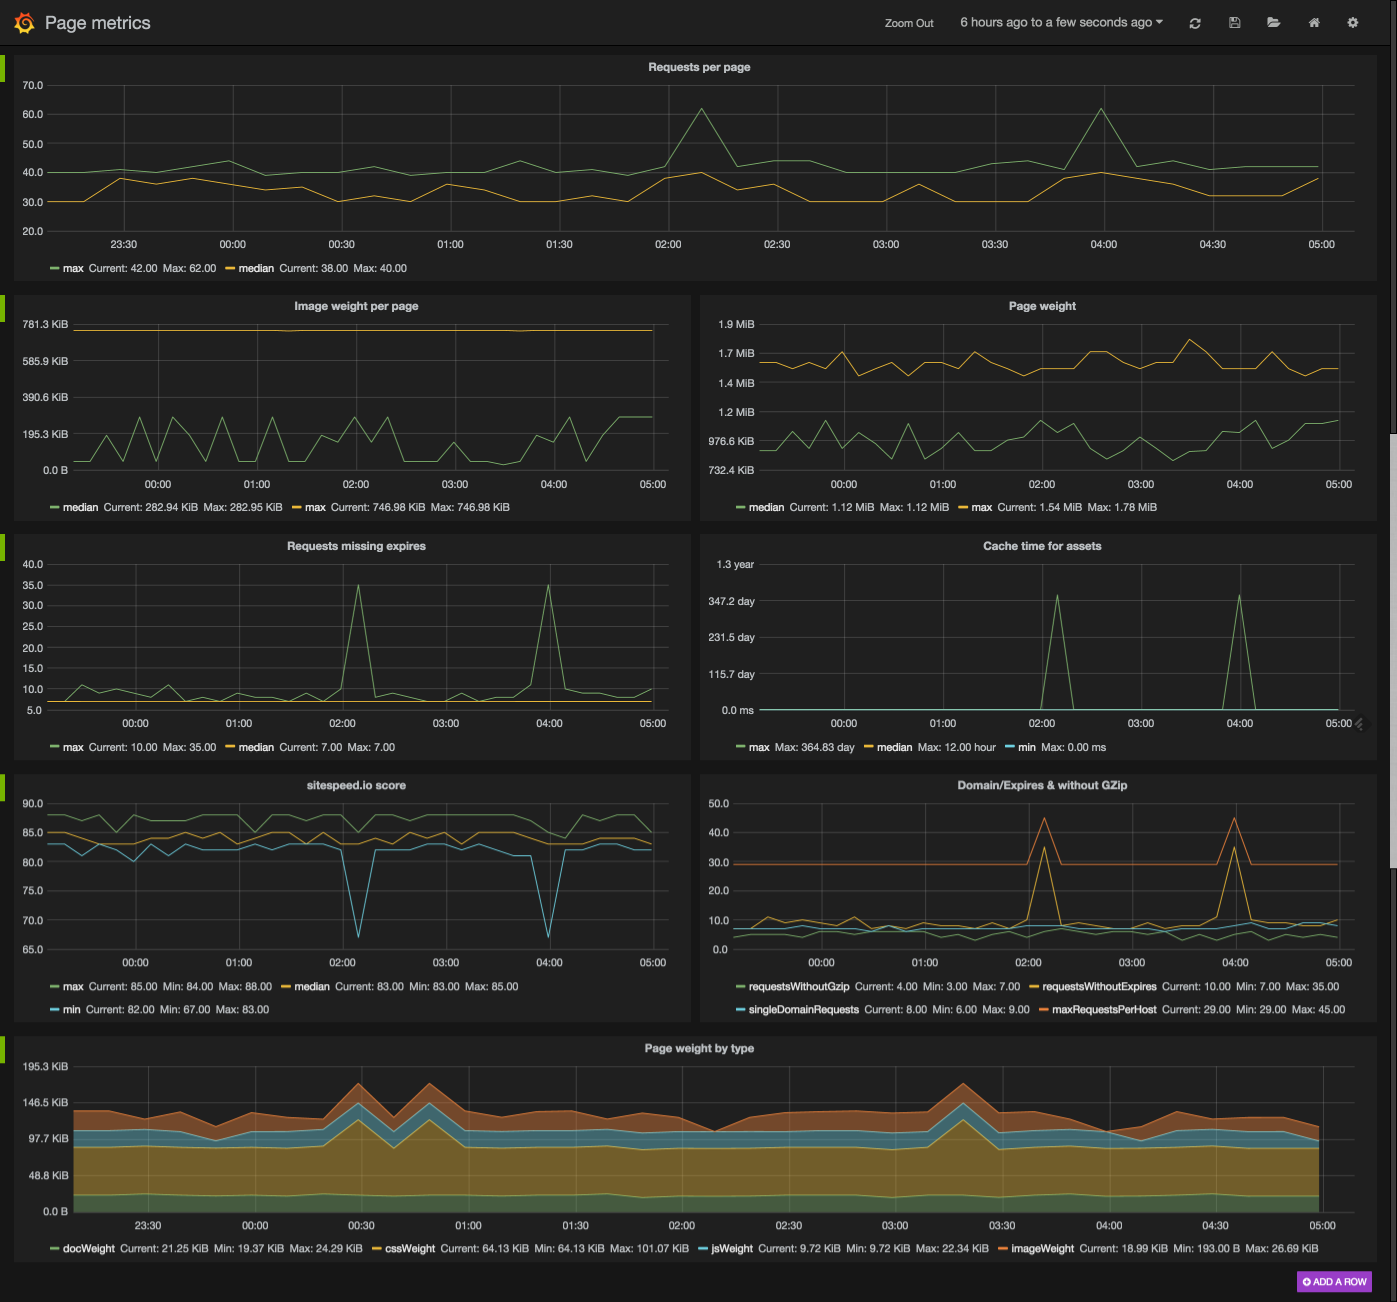
As an bonus you can have your graphs with dark background (that is hardcore). And the extra bonus is that you can graph how your page is built (weight by content type, cache times, request missing expires and so on). And that can look like this.
Wrap up
All the tools are open source, use them yourself and graph the metrics you want/need.