

We’re deep in the holiday season and you’re looking for that last minute speed gift. Here’s something valuable and 100% free Real User Metrics from Google Analytics. It checks your site speed where it counts from the user’s computer. And GA has plenty of sophisticated functionality, like filters to prevent robots from faking out your measurements.
There are just a few important issues to smoke out when using Google Analytics. Take care of these and you’re golden.
Averaging
The biggest GA speed issue? Averaging.
Google gathers thousands of speed measurements and then calculates a simple arithmetic mean. Think back to basic stats. Your teacher mentioned there are a few times when arithmetic mean doesn’t make sense. This is one of them.
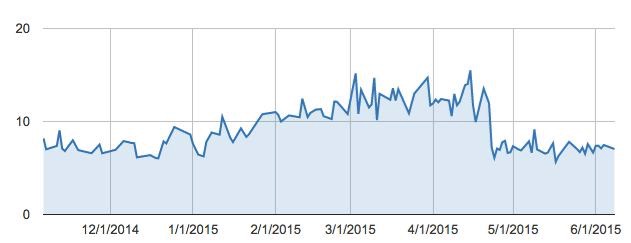
Source: Google Analytics
Fast loads are terrific. But a superslow load (say, 40 seconds) isn’t all that much worse than a slow load (10 seconds). This isn’t guesswork it’s quantifiable by sales and profits at various speeds.
The relationship between speed and profit is nonlinear. Yes, every website (and even individual pages) has a different profit/speed relationship, but the formulas are all exponential.
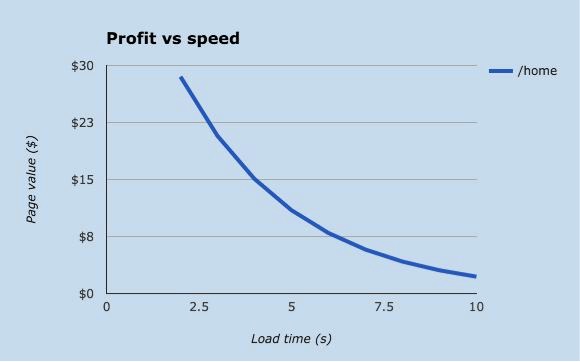
Source: Greenshade.com
Simple mean is not incorrect for page loads, it’s just the wrong number to look at. This is checking your engine’s RPM when you need the oil temp. Instead of mean, pull unaveraged raw data from GA and then run a median or better yet, geometric mean.
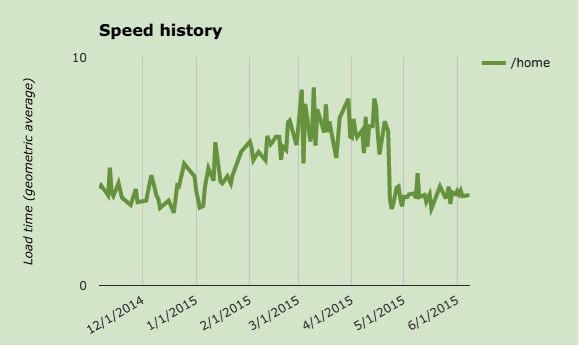
Source: Greenshade.com
Notice that geometric mean is smaller than the Google Analytics average. For the dataset pictured, load time is about 50% of mean. You might see different numbers, depending on how much variation is sitting in your data. Geometric mean is also less volatile than arithmetic mean you can focus on the true speed changes more clearly.
Consolidation
GA naturally measures timing for every URL you feed it. But many pages display URL variations depending on user id or other markers (example: /wintersale/id/4549245). Since these pages are using the same code and should take the same time to deliver, they should be consolidated in your average. Use text substitution to bring similar pages together. Keep track of the changes you make and store the consolidated URL in a new field.
Sampling rate
Google only measures 1% of speeds by default. If your site is running huge volume, this is not an important issue. But mediumsized sites need to measure more data or their signal is swamped by noise. So boost your sampling rate (as communicated in your GA tag).
Take care not to move too high (above 10k hits/day) or you will skew your sampling towards customers in particular timezones. Bring your site’s volatility and growth rate into account when setting this tag. We built an automated tool to calculate the best number from your site’s history shoot me an email if you’d like to use it.
Timing the right event
Google measures load time by default. This works fine for some sites, but other websites pull graphics and other data after the onload event. And Single Page Apps render the onload event pointless. If you’re in this spot, just build User Timings in Google Analytics. Remember always time the entire interaction, from user action to complete site response.
Setting up for 2016
Google Analytics is a superb tool that goes much further than timing your site.
It’s often used just for measuring user interactions and page value. But why not take full advantage and extend to speed? GA outshines other (paid) speed packages in many respects. It just needs a little elbow grease to pull the true speeds.
As you fix your performance goals for 2016, make sure to accurately peg your real speed. Google Analytics is a brilliant way to get the job done right.