We’ve all been there. You’re putting together a proposal or a slide deck or a blog post, and you think to yourself “Oh, man… it sure would be great to include some stats around how performance affected [insert metric of your choice]. Now how the heck do I find that stat?”
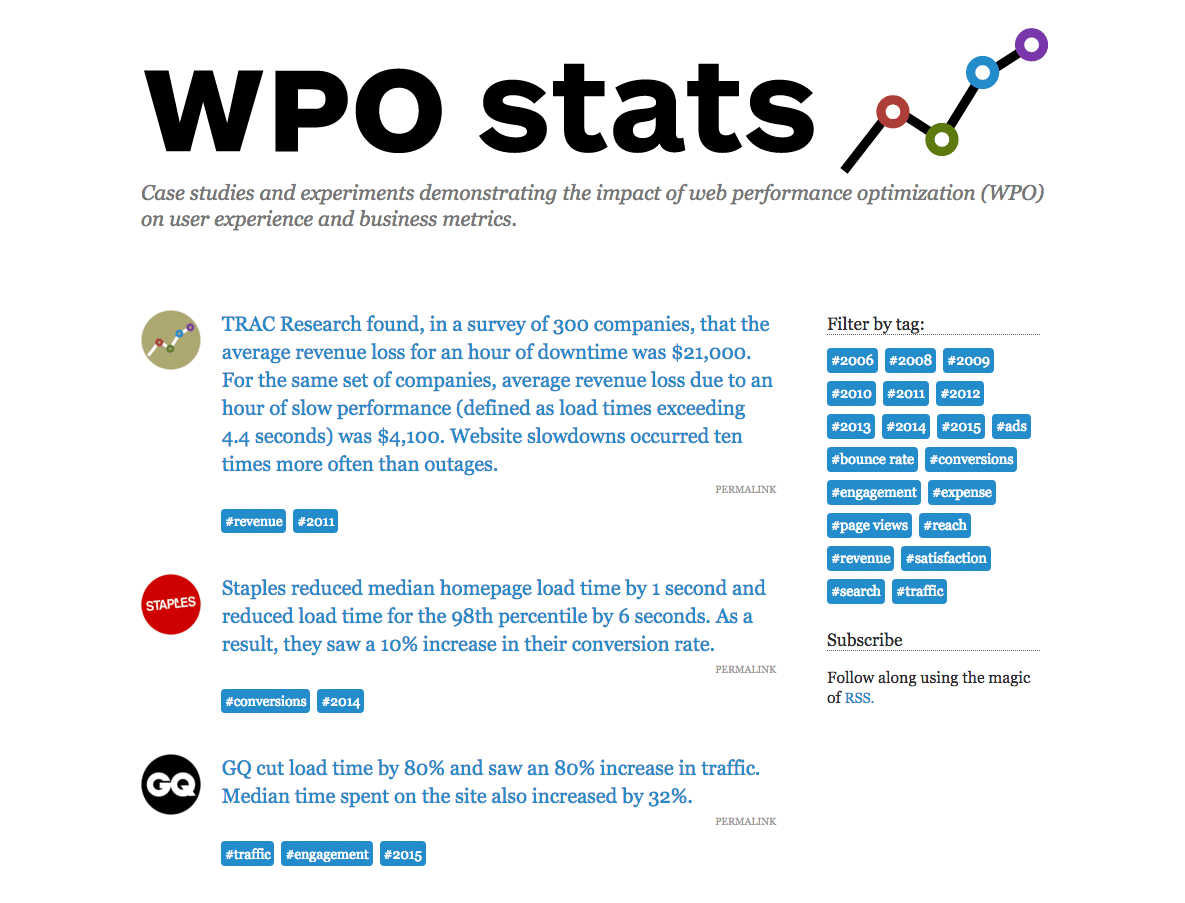
Sure, you may be in the obsessive minority of people *raises hand* who keep an exhaustive set of bookmarks for exactly these occasions. But chances are you’re a relatively normal person. WPOstats.com is for you. It’s a non-commercial (i.e. we’re not making any coin from it) repository for data-driven stories about the impact of web performance optimization (WPO) on user experience and business metrics.

Tim Kadlec and I launched WPOstats.com last month — though, to be frank, Tim deserves the bulk of the credit for building and launching the site. I’m tagging along as a contributor and super-user. When you visit, you’ll see it’s pretty easy to navigate by whatever metric you’re interested in, from page views and bounce rate to SEO and revenue.
The case studies go back to 2006 and encompass a broad swath of business types — including SMBs, retail giants, ecommerce vendors, SaaS, media, and government.
WPOstats.com is a living repository, and we welcome your contributions. Tim has done a great job of making the contribution process as simple as possible, even for non-technical folks. (It got me to finally use my GitHub account. Now that’s saying something.)
- All you have to do is go here.
- Open up a new issue.
- Fill out the short template. Like, this template is seriously short. All we need from you is a one- or two-sentence key takeaway, a link to the story source, the year the case study came out, and at least one appropriate tag. (See the list of tags in the sidebar of the site for suggestions.)
- Then hit the “Submit” button and wait for us to add it to the site.
- There’s an optional step 5, which involves eating celebratory cake, but we’ll leave that part up to you.
Consider this a little holiday gift. We hope you find it useful!
