

Patrick Meenan (@patmeenan) created WebPagetest while working at AOL and now works at Google with the team that is working to make the web faster.
I split my time primarily between working on WebPageTest and making Chrome faster. The two go along with each other really well because on the WebPageTest side of things I look at a LOT of waterfalls of web pages loading and when something looks like it could be done better I can try to find a way to do it automatically and go implement that in Chrome (or just about as often, something makes me wonder why Chrome is doing something the way it is and that leads to a fix).
Usually for loading-related improvements we are trying to get the visual content on the screen as quickly as possible which means optimizing for a combination of the first meaningful paint and the Speed Index and trying not to regress performance on the classic metrics (page load time and DOM Content Loaded primarily).
When we are initially experimenting with ideas we will often run tests on WebPageTest to evaluate and iterate on a change before moving forward with it. In the really early stages it usually involves uploading a development build and as testing progresses we might add the change behind a command-line flag and test it in production canary builds. Depending on what the change is targeting we will test it against a variety of sites and usually with desktop on a cable connection and mobile on a 3G connection to see the impact on both ends of the spectrum.
Final validation of a change is always done with a field trial and collecting performance metrics from the field, at a minimum to make sure we didn’t regress with real users. Some metrics like start render and Speed Index can’t be collected from the field so we make decisions to launch based on a combination of the lab tests and field trials.
Getting Consistent Results
Since we run tests against live websites, getting consistent performance results is challenging and a lot of the techniques I use for running the tests apply to testing various site changes against each other just as they do for testing browser changes. The php cli scripts I use for automating the A/B testing are in the “bulktest” directory of the WebPageTest repository on github and take care of a bunch of the techniques:
Running URLs back-to-back: Live sites tend to change over time. Both in content and in performance as they go through the cycles of being busy and having minimal traffic. Instead of submitting all of the URLs to be tested for one configuration and then submitting all of the tests for the other configuration the script will alternate between configurations as it submits each URL. This gives the highest likelihood that both configurations will be testing the same content under similar conditions.
Running URLs on the same test machine: WebPageTest supports an “affinity” string that can be included with a test when the test is submitted. The string basically hashes across the test machines so that tests with the same affinity string will be run on the same test machine. In case there are slight differences between test machines/phones the script uses the URL being tested as an affinity string so that a given URL is always tested on the same device.
Multiple Runs: Live sites can have noisy performance characteristics so we usually run anywhere from 5 to 9 runs for each test to increase the changes that we will get comparable performance between the different configurations.
Selecting the metric to use for picking a representative run: By default WebPageTest will pick the run with the median page load time (onload) as being the representative run for the given test. Given that we are usually optimizing for start render or Speed Index we override that by passing “medianMetric=SpeedIndex” as an option when getting the test results. You can provide any metric and that will be used for selecting the representative run instead of the page load time.
Using the fastest run: Did I mention that live sites have noisy performance characteristics? Usually a large source of variability comes from the server response time for either the base page or a couple of individual resources and it can wildly throw off the times. Instead of using the median run I prefer to use the fastest run to eliminate as many server-induced delays as possible (particularly since we are optimizing the front-end/loading and not the server). It’s a hack since it’s not really the median run anymore but if you pass “medianRun=fastest” as a query param when getting the test results then instead of picking the median run for the selected metric it will return the run that had the fastest time for the metric.
Re-running tests: Once the testing is complete, the scripts will go through all of the test results and any where it looks like there were issues or the results are not comparable will be flagged as invalid and potentially resubmitted. Usually I will resubmit tests until the number of successful/comparable tests stops growing significantly. Some sites never converge or the sites are just broken so it’s never 100% of the results. Any that don’t validate against each other are ignored when processing the results.
Web Page Replay
If the results from live sites are too noisy to measure the impact of the change then we will run tests against recorded versions of sites.
Web Page Replay is a python script that works as a transparent proxy and can be put in record or playback mode. In record mode it passes requests through to the original sites and records all of the responses and then when you exit it saves the recording for all of the HTTP requests in a static file. In playback mode it loads the recording (containing all sites visited) and always responds with the recorded version of resources when asked by the browser or 404’s for content that it doesn’t have. It also injects some code into the pages to eliminate sources of variability (random numbers, times, etc).
I run a Web Page Replay instance in playback mode in the Dulles location of WebPageTest with ~2,000 URLs recorded for use in this case and can point browsers to it using command-line options.
Web Page Replay can significantly improve the variability of results though it’s more useful for browser testing than site testing and there are a few caveats:
- The entire recording set is held in RAM. This is to eliminate latency in responding and is from the days before SSDs were readily available but it seriously limits the size of the recording set you can use and requires fairly beefy hardware.
- Python doesn’t make for the most scalable web server. Running tests from dozens of machines against one replay server can introduce variability in the responses. To help combat this I am running it behind a nginx reverse proxy so nginx can serve any cacheable static files directly and python only comes into play for serving the recorded dynamic pages.
- We have observed some playback issues where incorrect content is served for a given URL. It is consistent in that it always serves the same content but the content is wrong. It’s not yet clear if this was caused by a problem when recording or a matching problem during playback but it’s on my radar to look into.
- It doesn’t support HTTP/2 and doesn’t mirror the server TCP characteristics of the original servers. Specifically around things like the initial congestion window. Not a huge deal for a lot of tests but it is one more step removed from reality.
Eventually it might be worthwhile to rewrite Web Page Replay in Go so it scales better and design it to work with a SSD cache but for now it works well enough for the testing we do with it.
Validating Test Results
When validating tests against each other to make sure the different permutations are reasonably comparable the scripts will check several metrics against each other:
Were the tests successful? If either test failed for some reason (404, timeout, etc) then they will be flagged for re-running. This doesn’t include content errors where individual resources failed, those are considered successful tests. The script also validates that a bunch of the metrics exist and look sane to make sure there wasn’t a testing issue (or a problem with video capture).
Similar server performance? Since the server response time for the base page will directly impact all timing metrics we make sure that the time to first byte is within 200ms of each other. It’s pretty arbitrary and allows for slight variations but eliminates cases where there were significant server issues for one of the tests.
Similar number of requests? In case there was an ad or other dynamic piece of content that changed the page behavior significantly we make sure the number of requests between both iterations is within 5 requests of each other. Again, fairly arbitrary but filters out most of the cases for large content differences.
Same content? Finally, the screenshots of the variations are compared against each other to make sure the pages were similar. WebPageTest has an API entry point for comparing screenshots across multiple tests and returning a json blob for how each screen shot in the list of tests compared to the first screenshot. It uses the same histogram-based logic that is used for calculating the visual progress for Speed Index and if the pages are not at least 85% similar the test will be flagged.
Checking the Results
After all of the testing is complete there is a stats script that will generate aggregate-level stats and detailed spreadsheets about the different permutations being tested. The output is a collection of csv files which I will usually upload into a spreadsheet for further validation and eventual sharing.
Here is a spreadsheet with results from an experiment we are running right now for changing the priority of resources.
Once the spreadsheet is ready I’ll usually go through individual results to make sure any differences are a result of the experiment and weren’t just caused by something that the validation steps missed. For the most part this involves looking at the comparison filmstrips for the tests that showed the biggest changes between the different variations. Any that look like they were caused by testing issues (long server response times in the middle of the page load usually) get flagged manually for a re-run of the aggregate stats.
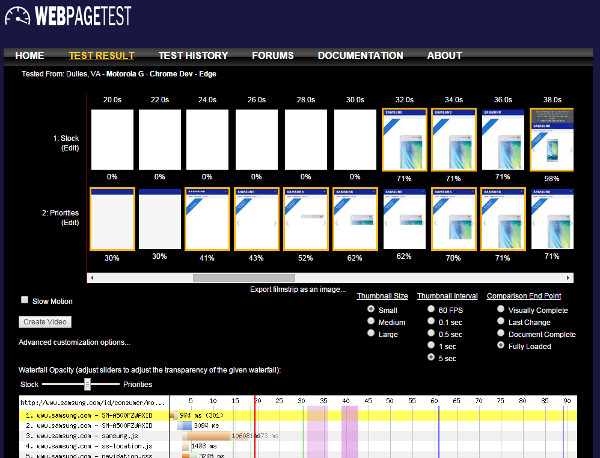
The spreadsheet also ends up being valuable for when you want to share the impact of the change. You have a set of before/after filmstrip links ready to go which can quickly be turned into videos.
Wrap-up
Synthetic testing (like WebPageTest) can provide a lot more details about how pages load and perform in a controlled environment than you can get from the field but there may still be variations in your results and hopefully some of the techniques above will help you with your synthetic testing.