Dean Hume (@DeanoHume) is a software developer and author based in London, U.K. He is passionate about web performance, and he regularly writes on his blog - deanhume.com.
As a web developer, I’m always excited when it comes to finding new data about the performance of the websites that I build. During my day-to-day development, I recently stumbled upon a tool called Lighthouse. It’s an open-source, automated tool for improving the quality of your web apps.

There are two ways that you can run this tool – either as a Chrome Extension or directly from the command line. You simply supply it with a URL, and it will audit the page, run a number of tests and provide you with a useful report on some of the metrics on how well the page performed. You can use the report to provide you with indicators on what you can do to improve your app.
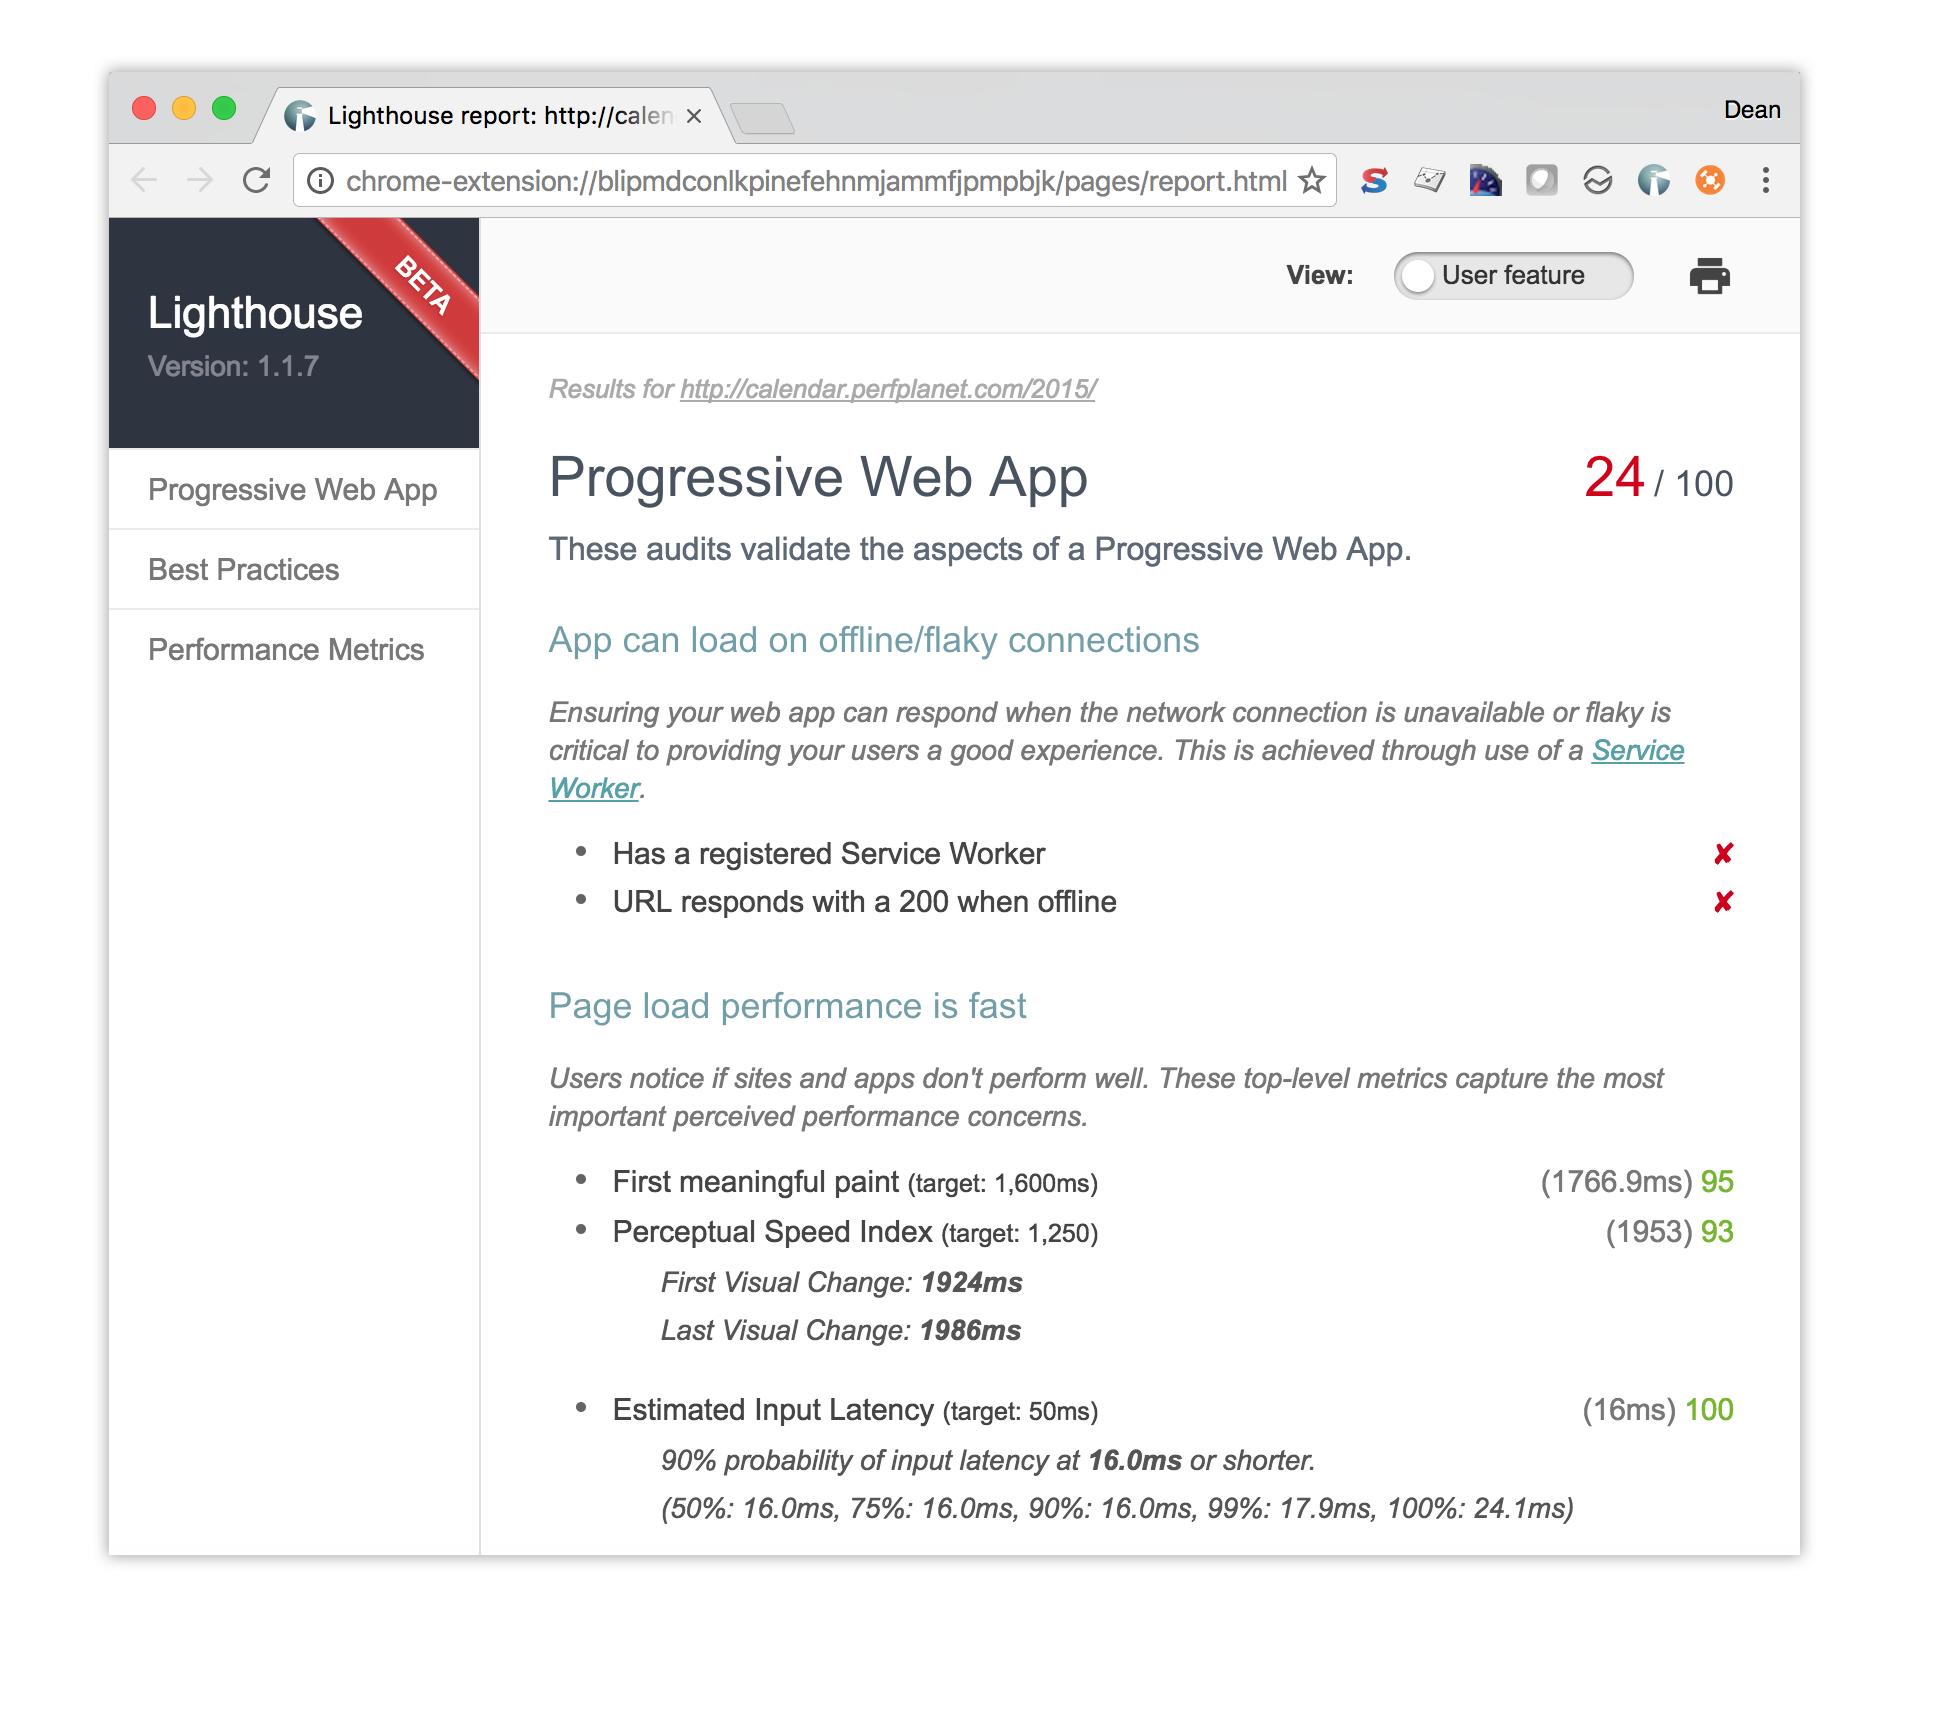
The Chrome Extension is handy when you simply want to see a user-friendly interface for reading the reports.

Lately, I’ve been lucky enough to start building a new web application that takes advantage of newer browser features to create a Progressive Web App (PWA). Lighthouse currently has a large focus on Progressive Web App features, such as Add to Homescreen and offline support. However, the overarching goal of the project is to provide an end-to-end audit of all aspects of web app quality. As a web performance fanatic, I am very interested in some of the performance reports that the tool generates.
This is where the magic of the command line tool starts to shine. Regardless of whether you are interested in building a Progressive Web App or not, the tool will provide you with useful performance metrics about your site.
In order to get started you will need to have Node.js installed. Next, install Lighthouse CLI using the command line:
npm install -g lighthouse
Once that has finished installing, you are ready to use Lighthouse. Let’s run a full audit against the Performance Calendar website by entering the following command in your terminal.
lighthouse https://calendar.perfplanet.com/2015/
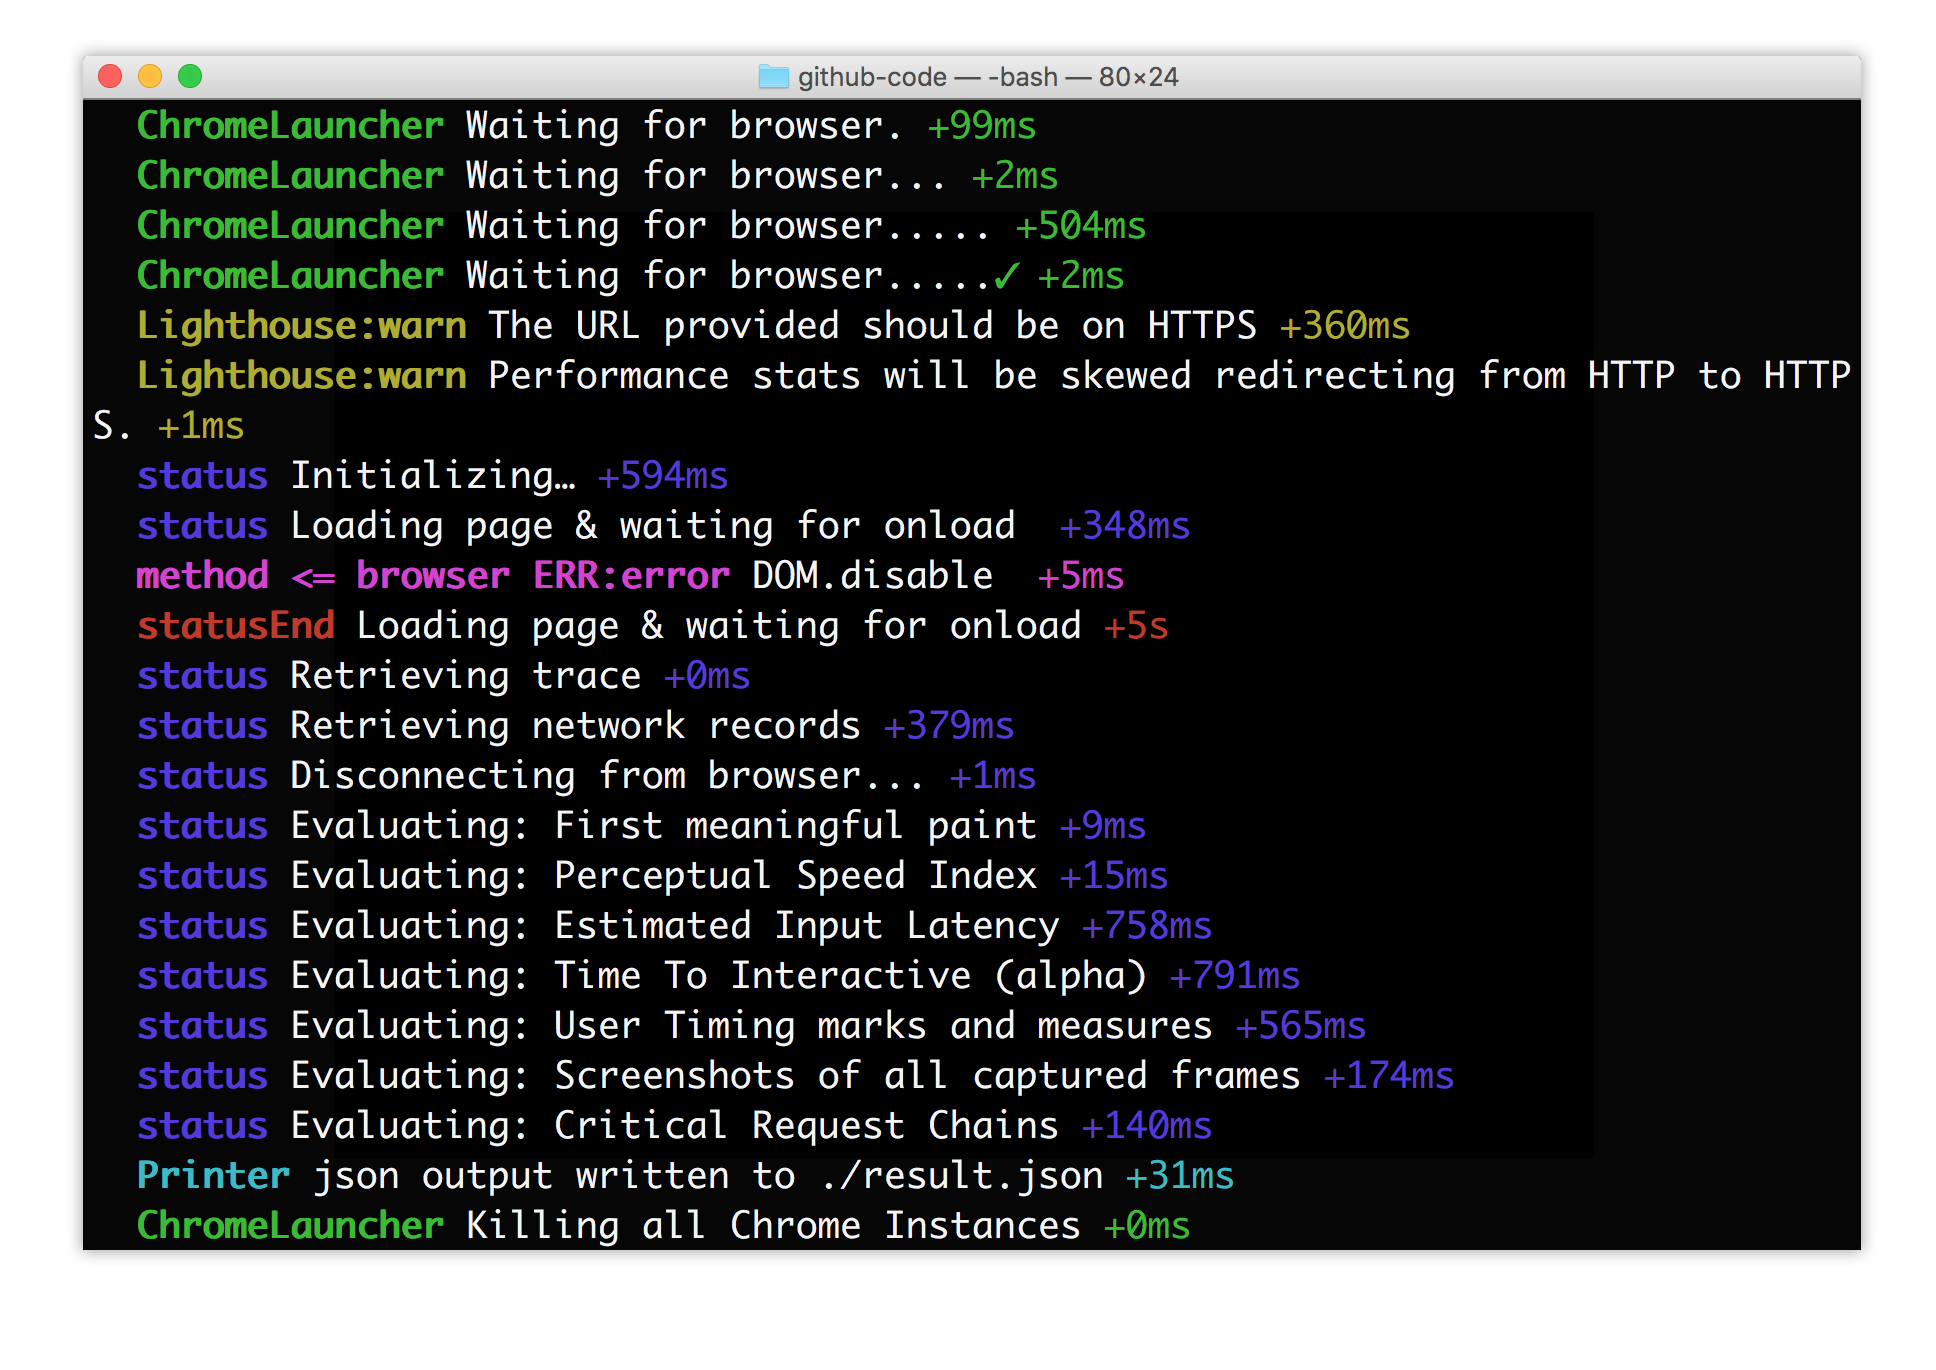
Under the hood, the tool looks for an installed instance of Google’s Chrome browser on your machine. Using Chrome, it then runs a set of tests and collects various metrics during the web page lifecycle.

Once the tool has finished running, by default it will generate a pretty HTML report similar to the one the Chrome extension creates. Depending on what you are building, you might not initially be interested in the full report, but rather narrow down to the performance metrics. You can do this by using the following commands in your terminal.
lighthouse https://calendar.perfplanet.com/2015/
  --perf
  --output=json
  --output-path=./result.json
The above command will generate a report with the given filename and due to the --perf flag it will only provide you with the performance metrics for the URL. The command will also output a JSON file giving you more insights into the data that was generated when the tests ran. The resulting JSON file gives you information such as time to first meaningful paint, the speed index, estimated input latency, time-to-interactive as well as any critical HTTP request chains in the page such as blocking CSS or JavaScript.
This flexibility gives Lighthouse the power to be used in a number of different scenarios. In fact, Lighthouse can be used to analyze trace and performance data collected from other tools such as WebPageTest or ChromeDriver. If you wanted to audit the performance of a URL on a real mobile device, Lighthouse can be setup to use the remote debugging on Android devices. You could even use the command line tool to integrate Lighthouse into continuous integration systems.
Best of all, Lighthouse is open source and you can contribute! If you’d like to contribute, check the list of issues or propose a new feature. If you’d like to learn more about this tool, I recommend watching this video by Google’s Jeffrey Posnick on YouTube.
