
We are the engineering team at Mozilla, based in Taipei, that was tasked with measuring performance and solving some specific performance bottlenecks in Firefox.
The major contributor to this project listed as below (alphabetical order):
- Bobby Chien
- Fu-Hung Yen
- Mike Lien
- Shako Ho (Major Contact Window)
- Walter Chen
And we also special thanks to the people listed below who help on accomplish this submission.
- Dominik Strohmeier
- Elvin Lee
- Havi Hoffman
- Harald Kirschner
- Kan-Ru Chen
This is a story about an engineering team at Mozilla, based in Taipei, that was tasked with measuring performance and solving some specific performance bottlenecks in Firefox. It is also a story about user-reported performance issues that were turned into actionable insights. It is the story of how we developed Hasal, a framework for testing web performance between different browsers. Hasal takes a new approach to testing that considers user perception in the process.
Back in 2016, Firefox performance was problematic. We had many issues to address. One of the critical issues had to do with user reports about performance problems of Firefox on office web applications — regarding slow page-loads as well as sluggish response times.
Taking these seriously, but also experiencing many of these issues during our daily work, identifying the root cause for these performance issues was a top priority for us. Unfortunately, user sentiments is very often unspecific which makes identifying specific problems and evaluating their impact hard. So, we decided to take a new approach.
We were trying to implement a framework without using WebDriver, which relies on specialized browser APIs and JavaScript injection to manipulate the browser. Instead we used Sikuli, which submits native-like I/O signals to the computer to simulate user action. We built a framework that lets you define precise user interactions on a web application and measure input latency time using image recognition and real-time measurement instead of DOM events. After working hard for about a year, we successfully implemented Hasal to compare the Actual Input Latency between different browsers on various web applications.
What is the actual input latency?
Based on Google’s “Measurement Performance with the RAIL Model“, Actual Input Latency is one of the key metrics that extends measurements of web performance beyond page load and focuses on responsiveness and in-app navigation.
In typical web applications, browsers spend most of their time on waiting for network resources to be downloaded and running JavaScript. The goal of the Hasal implementation was to focus on the latter, meaning that we measure the time elapsed between an I/O event and the web application’s first response as perceived by a user. Therefore, we measure only the time from user input to the screen’s initial change. We define this measure of time as the Actual Input Latency.

Implementation Concept
-
Basic concept
Our goal was to implement a tool built from the perspective of user perception. We designed our workflow so that each and every simulated user step would be based on image recognition, and every numeric measurement would be based on visual analysis.
-
Basic flow
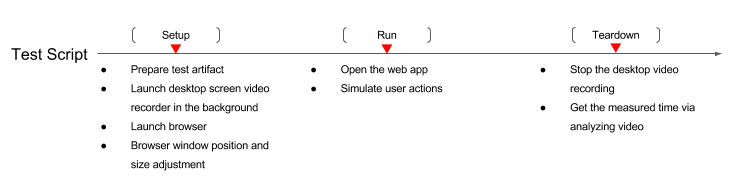
Our framework is based on the PyUnit framework in combination of Sikuli. You can see our workflow in the figure above. First, we have some prerequisite tasks in the setup() function. Next, it executes the simulated user steps in the run() function of a designated test. Last, we get the final output from teardown() function.
Each simulated user interaction is screen-captured for analysis. Hasal relies on video recording and image extraction to get the desired results. The details of how we do this will be explained in the next few paragraphs.
-
Run details
When entering the run() function, we send a simulated I/O event to specific icons, images, or areas of the screen through the JVM (Java Virtual Machine). This way, we simulate how people interact with the web application. Also, we send the event log to the terminal at the same time via JVM. This is considered a marker to identify when the I/O event triggered.

-
Video analysis
In the teardown() function, Hasal finishes desktop video recording and starts to analyze the video. The basic idea of getting the measured time is to calculate the actual frames played during two key frames. The first key frame is marked when indication showed up in Terminal, and we assume that there is a very little time delay between indication shown in terminal and submission of I/O event. The second key frame is the first screen change in a certain area of the browser. In other words, the second key frame is the indicator of web application’s response in the first place. So, by calculating the actual frame number between the first key frame and second key frame, we can get the real response time of web application’s response to user action. For example, if we were recording in 90fps (frames per second), and we have 10 frames between 2 key frames as shown above, we will get an Actual Input Latency of 111.11 ms.
Example
To better illustrate the idea of how to get from a defined user interaction on a web application to Actual Input Latency measurements with Hasal, here is a small example from one of our test cases from our “social” category:
-
Latency for open online chat in Social Network App
In one testing scenario we measure the Actual Input Latency from the initial click on the online chat button to when the chat screen shows up., Here are the testing steps. These steps are the ones that are translated into the linked script:
The user wants to open a chat window on Social Network App. Therefore, they will select a friend from their list and click on the respective friend to launch the window and wait for it to load.
Setup
- Open the browser and enter the Social Network App url in url bar
- Login to Social Network App and wait for the page to be fully loaded
- Make sure the friend list is not hidden
Run
- Move mouse cursor to one of the avatars in the friend list
- Take snapshot (Snapshot 1)
- Send the MouseDown Event
- Send the MouseUp Event and simultaneously send the Message to the Terminal Console and take snapshot (Snapshot 2)
- Wait the chat window to be launched
Teardown
- Close the chat screen
- Close the browser
- Generate the result:
The result of input latency will based on the Snapshot 1, 2 and the frames converted from video to come out the actual frames played.
More details on how each web application was tested can be found in the repository (https://github.com/Mozilla-TW QA/Hasal/tree/dev/tests).
Current Results
-
Performance improvement of most up-to-date Firefox
This framework was initially targeted to find the performance differences between Firefox and other browsers in specific web applications. After we finished examining targeted applications, we started to help with finding the gap in major web applications.
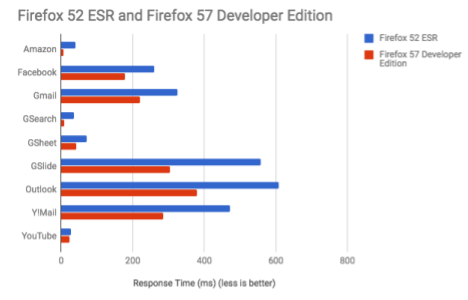
(The test result is based on the snapshot of web app)
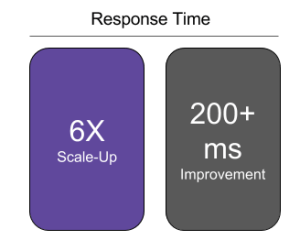
We have dedicated the Hasal framework to measure and improve Firefox Quantum performance. Over time, we have seen great improvements on Actual Input Latency for different web applications. In the above figures, we can see that Firefox Quantum’s response time has improved by up to 6x. Based on Hasal results, We have filed more than 200 bugs of which more than 80% were fixed for our Firefox Quantum release.
-
Other findings
From time to time, we’ve seen some performance regressions in our tests without any real changes to our browser. After confirming with the respective third party web service providers, we found out that we have been able to detect performance regressions on their side through our testing.
Limitations
The work on Hasal has been a constant iterative approach of implementation and testing. During the whole time of its development, we worked closely with other engineering teams at Mozilla to make Hasal as useful as possible to them. However, some limitations still exist which are important to keep in mind:
-
Measured time is limited by FPS
Since our measurement is based on captured frames, any action within one frame can’t be measured by this framework. In our laboratory environment where we record with 90fps, this threshold is at 11.11ms and any response faster than 11.11ms could not be detected.
-
Overhead could vary in different browsers
Since the framework heavily relies on capturing desktop video, there is potential overhead introduced. We have tried to choose a recorder with little overhead that records from hardware directly. However, this approach could introduce different overhead in the different browsers due to different implementations on leveraging graphics card computation power.
-
JVM version could also affect the measured time
As the Hasal approach also relies heavily on the assumption that sending an indicator to the terminal should only have a very short delay compared to sending I/O events to the browser, we have done a lot of profiling to make sure this assumption is correct. According to our profiling results, we can almost assure that the assumption is correct. However, we still found that different JVM version could break the assumption in certain environments. Sometimes, a newer JVM version could increase the time delay between sending the indicator to the terminal and sending the I/O events. We actually found that upgrading Java introduced a delay of 20ms.
Onward
While the current Hasal implementation has proven to be useful to guide engineering work on fixing critical performance issues, there are some open issues that we will need to target next to make Hasal useful as a general framework for testing performance.
-
Portability
This framework is a combination of many tools. So, it requires a time-consuming installation script to deploy the framework. That also raises the barrier to use, due to the difficulty of installing and reproducing our test results in other environments. Therefore, trying to make it simple and easier to install in others’ environment will be our next step in the future.
-
Mobile
The overall concept of our framework should apply in mobile devices as well. However, we might need to change few things before we can proceed. First of all, the video recorder might need to be replaced by snapshot or screen capture software to minimize the CPU power consumption and improve the efficiency. Also, the host connected to the mobile device should be responsible for calculating the results.
-
Less overhead
We already talked about the issue of potentially introducing non-negligible overhead in some scenarios by relying on a software desktop video recorder. So, we’ve also considered having an alternative solution to record the whole desktop screen. For example, an external HDMI recorder or external high-speed camera would be a potential choice for us to further investigate.
-
Profiling
When you find a scenario with a significant performance issue, typically you file a bug for it. However, a bug does not provide the detailed information during testing such as detailed profiler data needed to take the next action. That’s missing in our current framework. It’s not easy to figure out a way to combine the actual visual representation with the code stack. But we are trying to integrate them via indicators and markers in profiles. This could help us understand two different things in the same timeline and let engineers understand more about the situation.