

HTTP Archive provides an amazing trove of data for synthetic monitoring data for the top Alexa websites. Analyzing this data has led to ton of key performance insights over the years. However, this does not capture the diversity of the users across the web – which is better analysed by looking at Real User Monitoring data (RUM). Till recently, there has been little publicly available RUM data across websites on a large scale.
This changes with Google publicly releasing RUM data from Google Chrome this October. The data is well-packaged into Chrome User Experience Report (CrUX), with 1,241,019 websites (as of last month) from a wide range of industries and locations. The data includes performance metrics such as the time to first paint (TFP), onload, etc. from real users using the Google Chrome browser from a variety of devices and connections. It is loaded into Google BigQuery as a public dataset for anyone to play with.
Understandably, the raw data points are not provided to protect the privacy of the users and analytics metrics of the websites. Instead, the results are aggregated across different dimensions such as device and connection types. A detailed explanation of the data, insights gathered and the pitfalls to avoid when analyzing the data can be found here.
As we worked with the data, one thing was abundantly clear – it is hard to visualize the data across dimensions. To facilitate that, we introduce Real User Experience Tool (rUXt) – a tool to visualize the UX data from the perspective of real users.
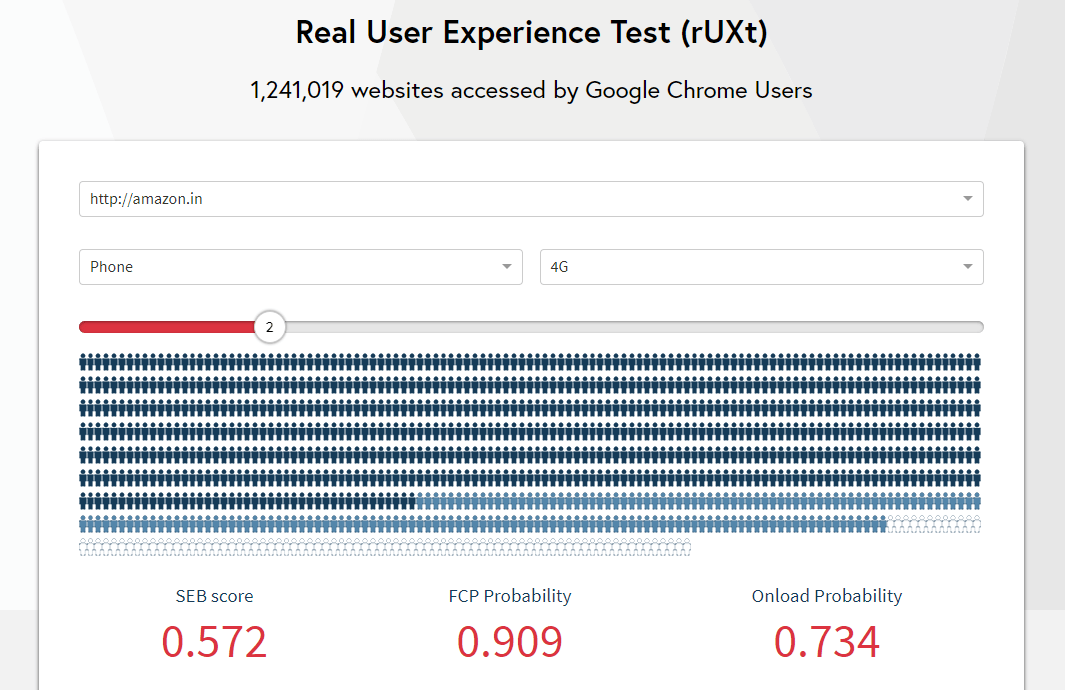
We focused on time to first contentful paint (TFCP) and the onload time – two crucial metrics for understanding user experience and the overall performance of your page. After choosing any one of the million websites, the device and connection type, you can visualize what percentage of users for the website have finished the first contentful paint and onload at that point. You can also see the percentage of users without having any content on the screen. We also report Site Experience Benchmark (SEB), the probability of the the TFCP is less than 1 second for a website.
The tool can be used to show user experience metrics over 1 to 10 seconds, and this visualization can aid as a snapshot of how real-world users across the world are presented with the website experience. We believe this tool will help businesses understand how their users react to a slow loading website on a macro level. This can invariably lead to new KPIs for performance with a focus on user experience and can encourage competition across companies in an industry to see who is the fastest.
The tool is hosted at https://ruxt.dexecure.com and the entire code is open-sourced at https://github.com/dexecure/ruxt (frontend) and https://github.com/dexecure/ruxt-backend (backend). The front-end is written in Next.js while the backend uses a combination of elasticsearch and redis to cache the results from BigQuery.
The tool will be updated as data is released by Google each month. Looking forward to the feedback (and pull requests) from the community!