

Artem Denysov (@denar90_) is working on projects that make developers lives easier.
We are talking a lot about performance, how it can be improved, which tools to use for performance improvements but less about how to keep reached performance on a proper level. So, let’s take a look at tools which can help you to do so.
Size Limit
Size Limit is a tool to prevent JavaScript libraries bloat. With it, you know exactly for how many kilobytes your JS library increases the user bundle.

Sometimes, adding new library or piece of code (ES next feature), it’s not clear how it influence on bundle size. Taking a look at Babel example with ES2015 Classes will cost 2.22Kb additional code (355B -> 2.77Kb). And it’s just simple one.
As a result, we can end up that time to deliver larger file size to the user (especially if it’s a mobile user) will be increased which can increase Time to Interactive. As we know, if this time became too hight then users became angrier, want to close an application and forget about it like a nightmare.

You can read more about it in a blog post and easily use with Continuous Integration (CI) system by adding one command to your script. It can be done by installing npm install �" save-dev size-limit and adding some lines of code to the package.json
"size": "size-limit 20KB dist/index.js"
Bundle Buddy
Here we also thinking about bundle size but from another perspective �” code splitting.
This feature allows you to split your code into various bundles which can then be loaded on demand or in parallel. It can be used to achieve smaller bundles and control resource load prioritization which, if used correctly, can have a major impact on load time.
Read more.
But the same pieces of code might appear in different split bundles. To reduce number of duplicates you can use this tool. It can be installed npm install -g bundle-buddy.
Running bundle-buddy my-app/public/*.map will produce super fancy report:
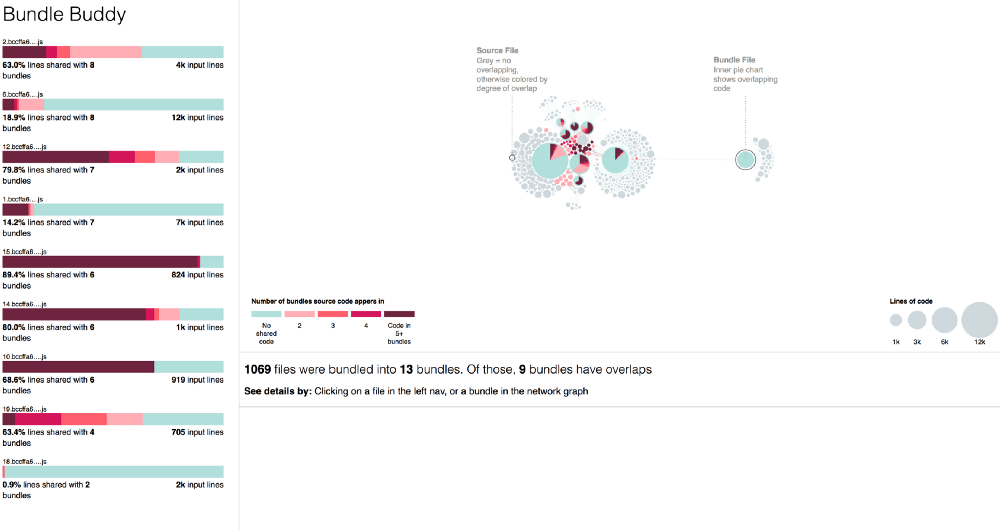
This enables you to fine tune code splitting parameters to reduce bundle invalidation rates as well as improve repeat page load performance.
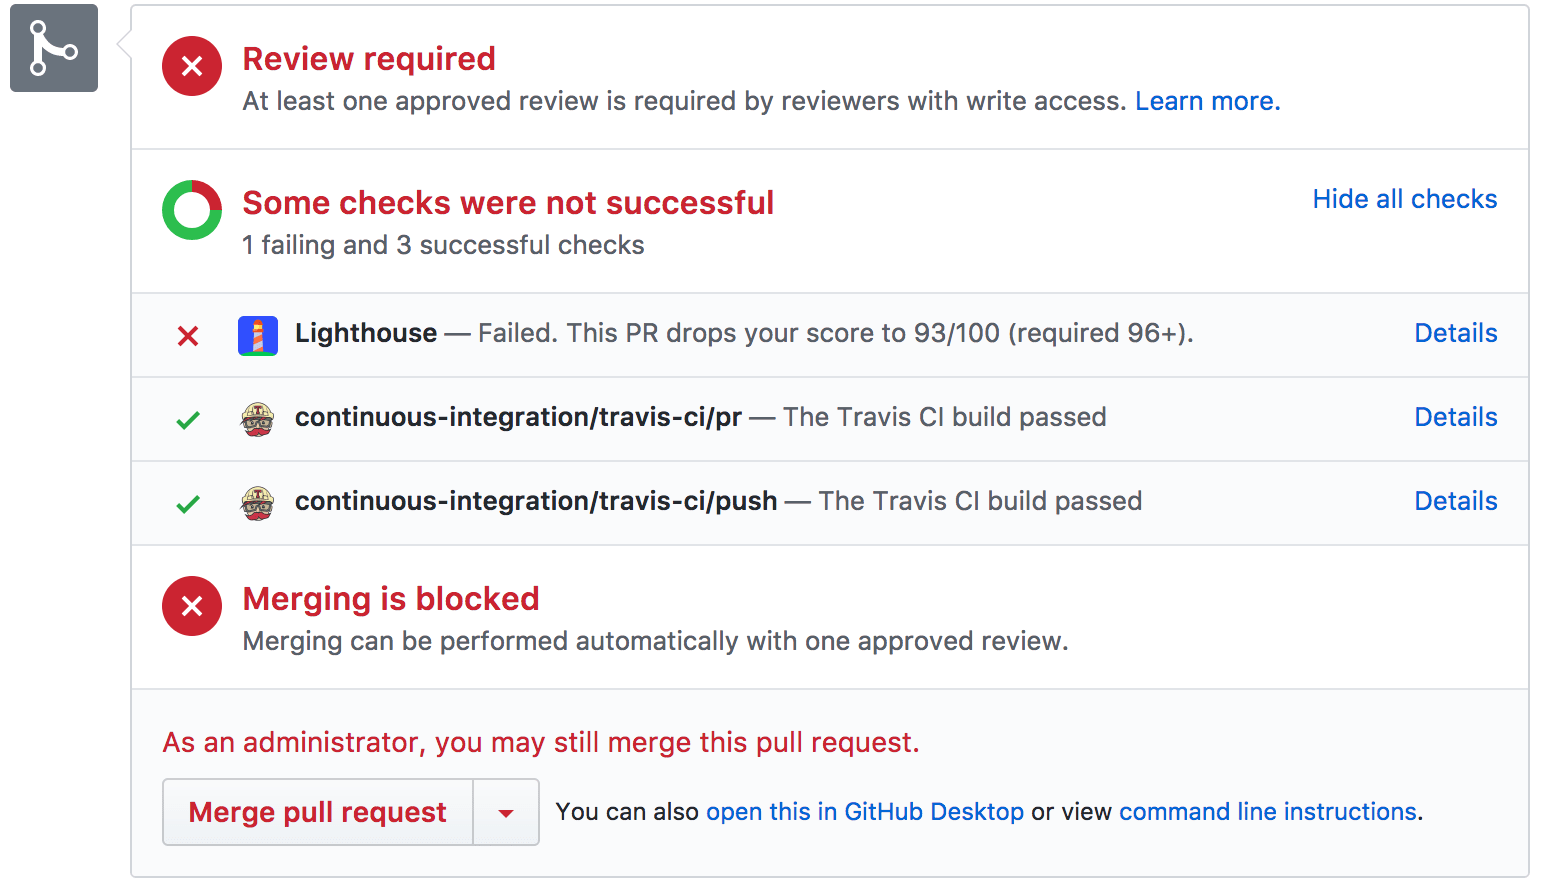
Lighthouse-CI
I hope that everyone heard about Lighthous, Lighthouse-CI helps run Lighthouse with CI providing solid reports about application performance.
Adding it to the CI script:
install:
  - npm install # make sure to install the deps when Travis runs.
after_success:
  - ./deploy.sh # TODO(you): deploy the PR changes to your staging server.
  - node node_modules/lighthouse-ci/runlighthouse.js https://staging.example.com
You will be provided by report like (of course if performance downgraded):
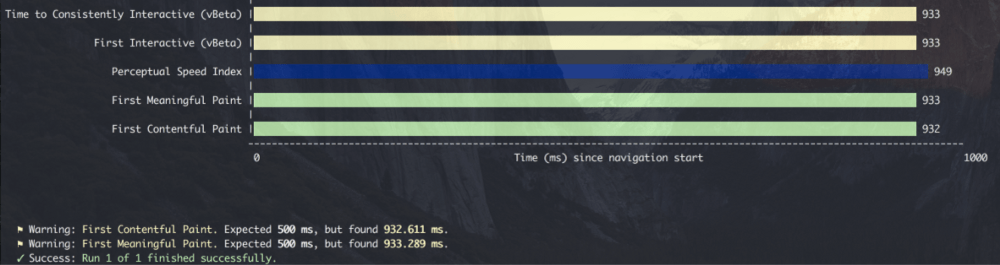
PWMetrics
Another wrapper over Lighthouse with its own goodness. One of features is expected metrics results for the application which became also handy with CI.
In package.json just add
"pwmetrics": {
  "url": "http://myawesomesite.com",
  "expectations": {
    "ttfcp": {
      "warn": ">=1500",
      "error": ">=2000"
    }
  }
}
Read more about all available expectation metrics.
Here is an example result of it running:
Read more about all features in a blog post.
It was all about Open Source, and here some services for your business solutions:
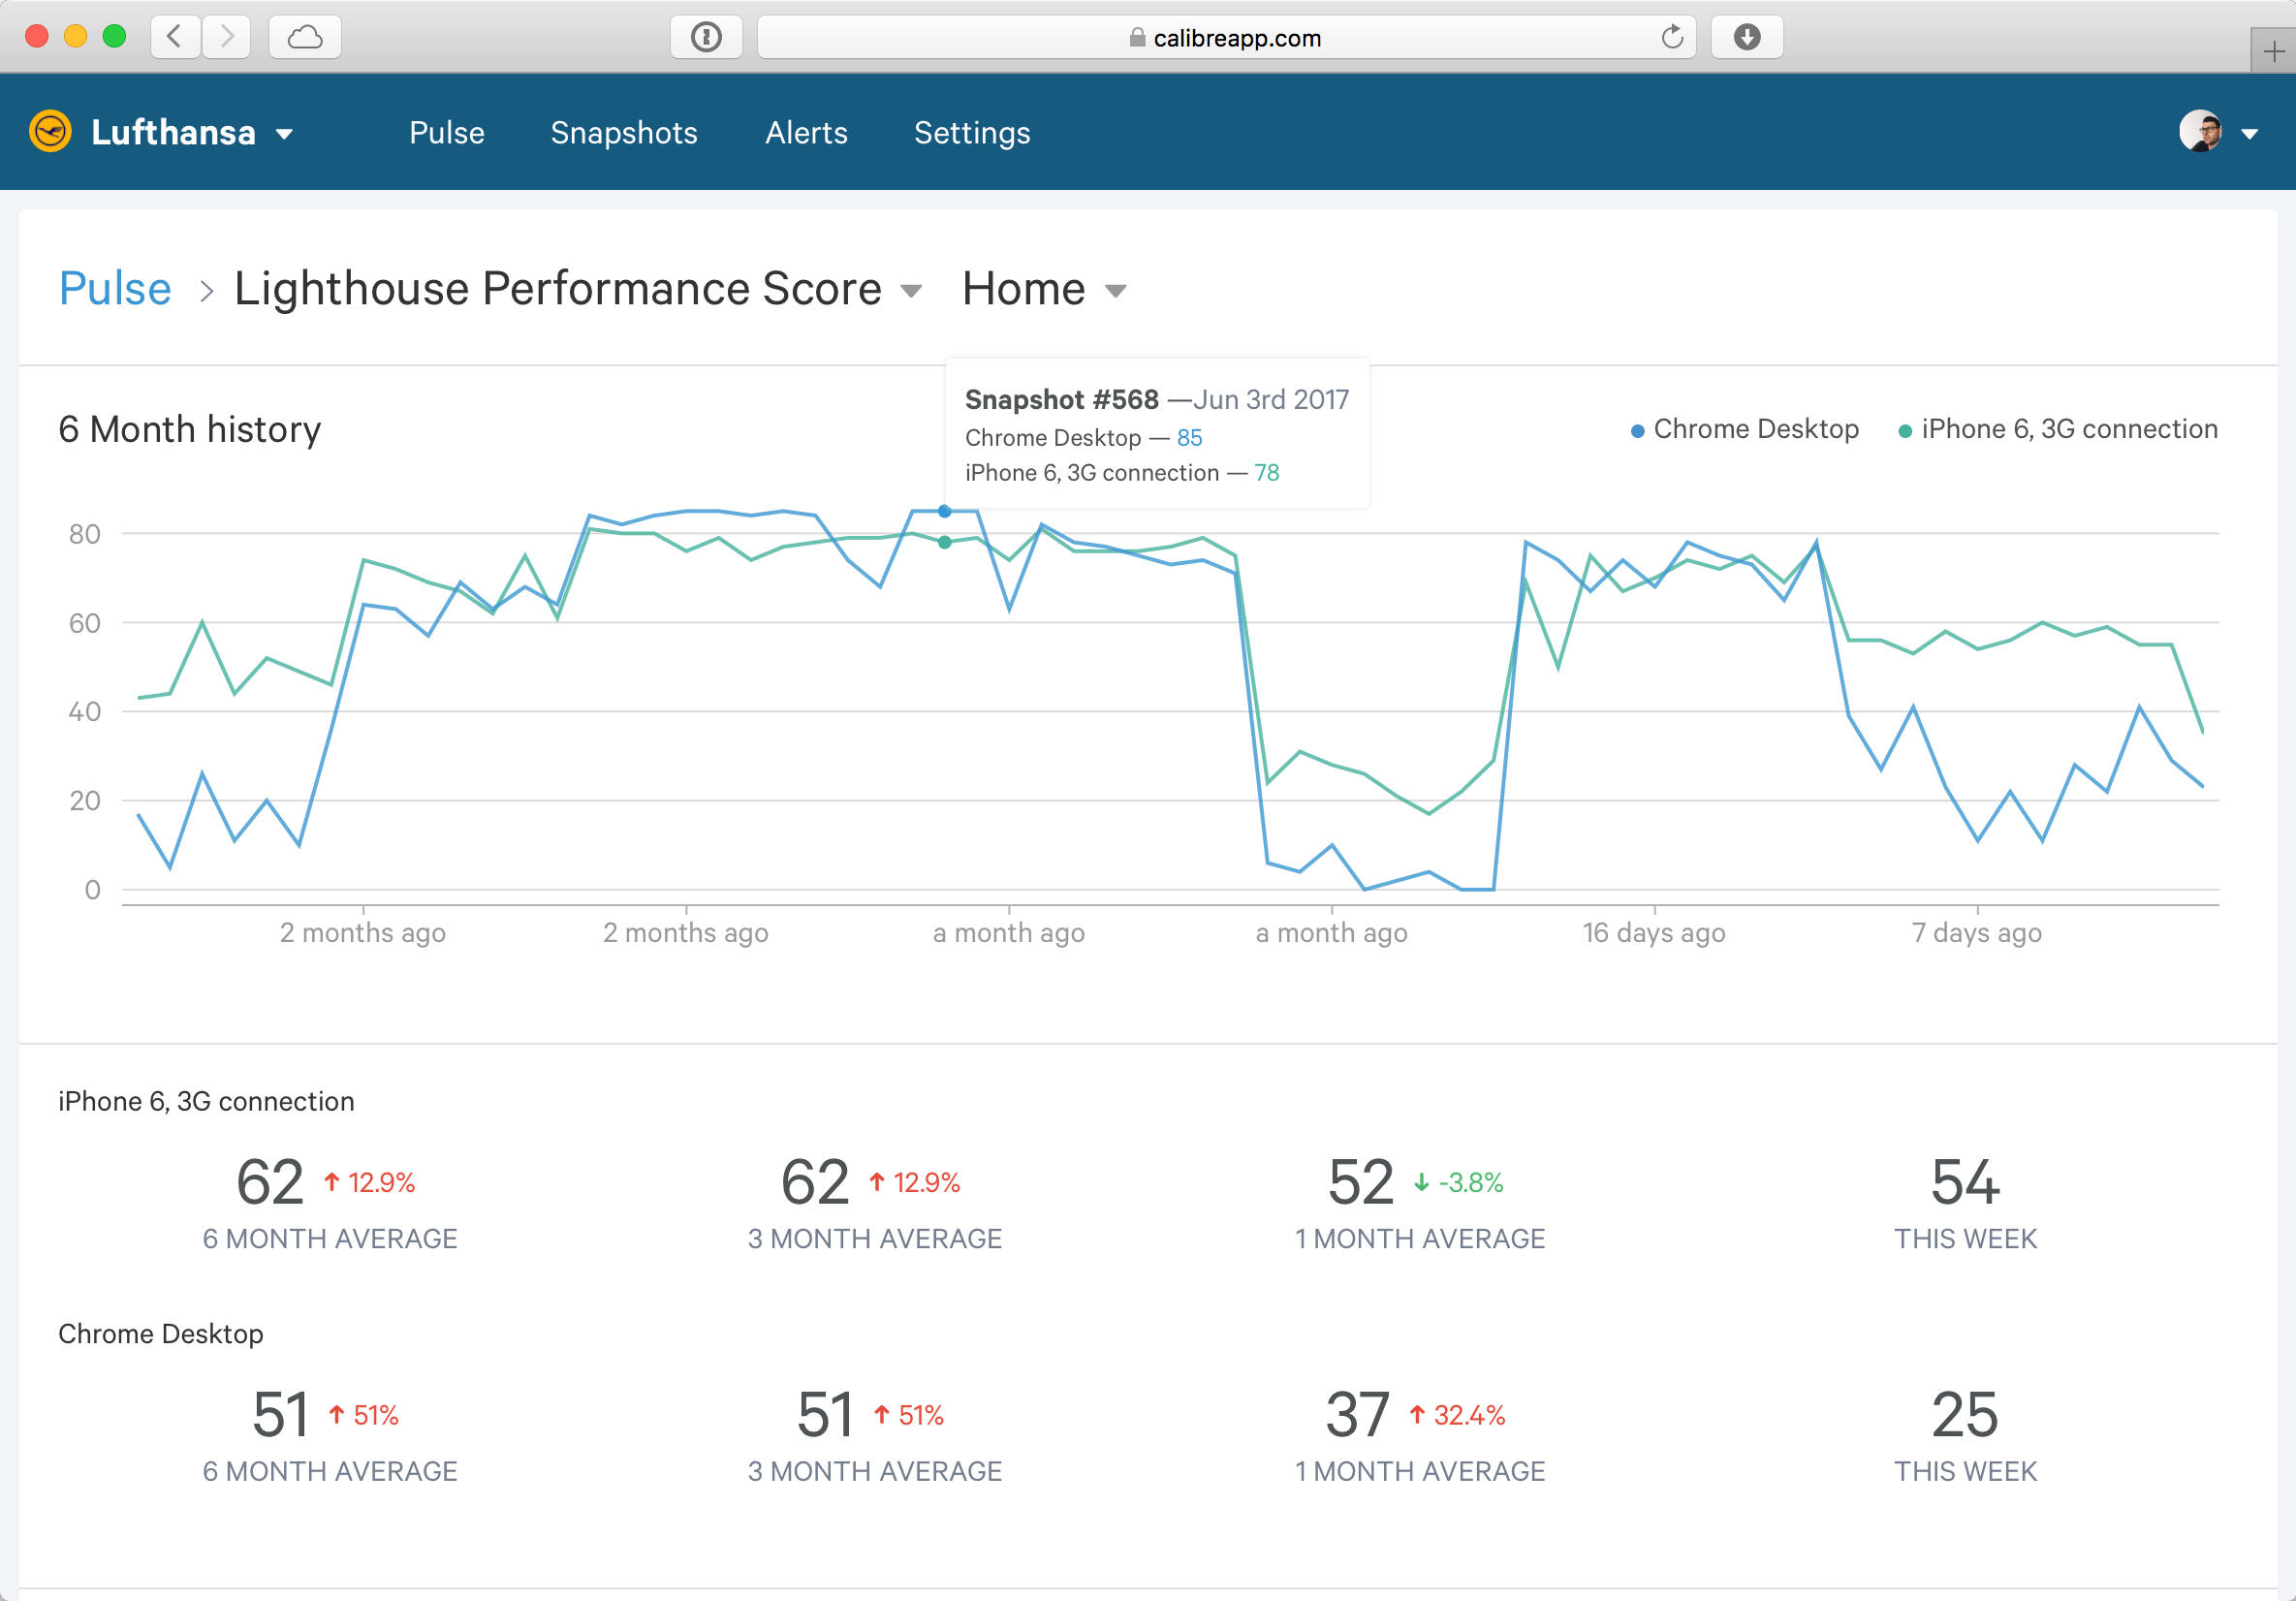
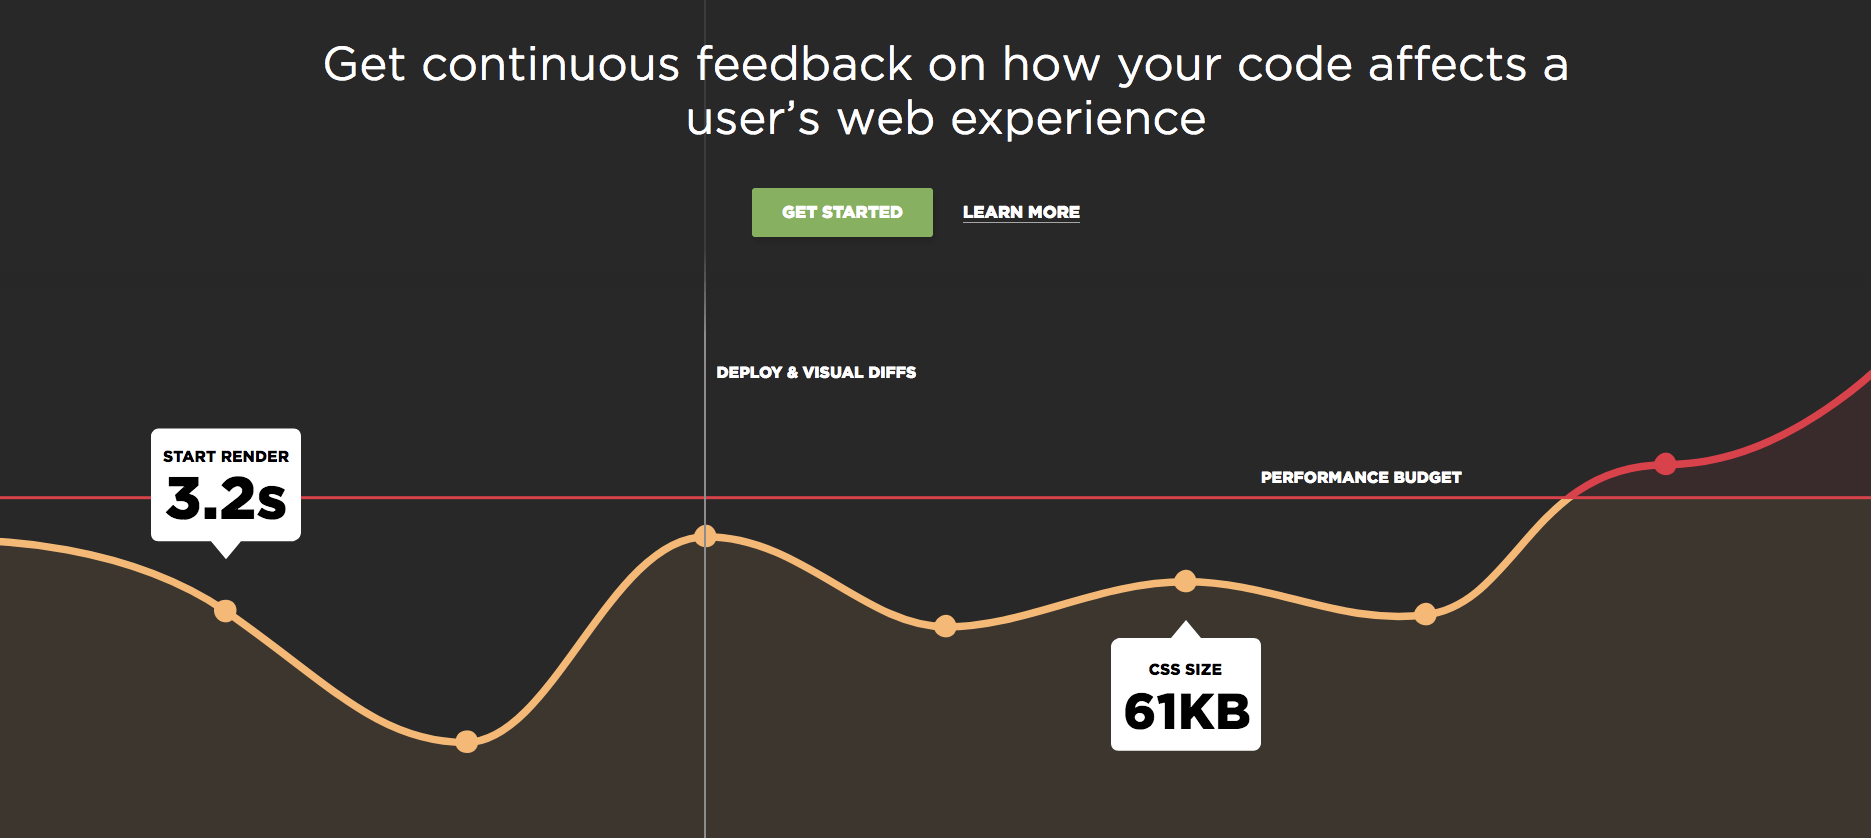
Calibre
Calibre – powerful performance monitoring gives the page speed insights you need to improve customer experience. Free 14-day trial.
SpeedCurve
SpeedCurve – Monitor the front-end performance and build of your website. Compare yourself to others and beat the competition. Start a 30 day free trial now!
Treo
Treo – is a cloud infrastructure for Lighthouse. It provides end-to-end testing, geographical regions, scalable API, and integrations with Github & Slack.

All of them have either free trial period or limited free usage. Try them all and choose one for your own needs.