

Steve works at SpeedCurve on the interplay between performance and design. He previously served as Google's Head Performance Engineer, Chief Performance Yahoo!, and Chief Performance Officer at Fastly. Steve is the author of High Performance Web Sites and Even Faster Web Sites. He is the creator of many performance tools and services including YSlow, HTTP Archive, Episodes, ControlJS, and Browserscope. Steve taught CS193H: High Performance Web Sites at Stanford and served as co-chair of Velocity.
The old bottleneck: Network
In the old days, delivering a fast user experience depended primarily on download speed. One reason why the network was the main bottleneck back then is that JavaScript and CSS weren’t used as much as they are now, so CPU wasn’t a critical factor. According to the HTTP Archive, the top 1000 websites download five times more JavaScript today compared to seven years ago.

Another reason why the network was the main hindrance to delivering a fast web page was that scripts were downloaded one-at-time and the browser stopped doing work while it waited for each script to download. Many people forget those days but surfing truly tested your patience, especially for sites with multiple scripts.
Over the last ten years, browsers have made numerous improvements to mitigate the download bottleneck including the lookahead parser, resource prioritization, and async script loading. This doesn’t mean pages are fast. As former Yahoo! SVP Ash Patel taught me, when you remove the primary bottleneck, the next one takes its place. Although the network is no longer the bottleneck, we now have to deal with CPU.
The new bottleneck: CPU
The biggest bottleneck in web performance today is CPU. Compared to seven years ago, there’s 5x more JavaScript downloaded on the top 1000 websites over the last seven years, and 3x more CSS. Half of web activity comes from mobile devices with a smaller CPU and limited battery power. Rendering and jank are hot topics because the browser main thread is choked swapping script execution for layout and layout for paint and back around again to script execution.
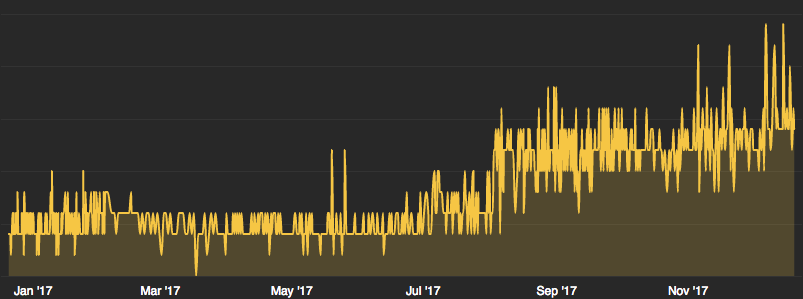
Therefore, it’s important to monitor how the browser main thread is being consumed. WebPageTest provides browser main thread metrics for synthetic monitoring. Here’s a chart that shows the script execution time for the Twitter home page over the past year. (Did I mention CPU consumption is increasing?)
In addition to having CPU metrics in synthetic monitoring, we also need them in Real-User Monitoring. This is where the Long Tasks API comes in.
Long Tasks API
The Long Tasks API is brand new with the first working draft dated 7 September 2017. Keep that in mind. This is a first step and improvements are in the works. Currently it’s only implemented in Chrome. Let’s jump right in with some code to get it working:
var aPE = [];
var observer = new PerformanceObserver(function(list) {
        var perfEntries = list.getEntries();
        for (var i = 0; i < perfEntries.length; i++) {
            var p = perfEntries[i];
            aPE.push(p);
        }
    });
observer.observe( { entryTypes: ["longtask"], buffered: true } );
You can see this code working in my Long Tasks test page. The code above registers the "longtask" observer with a function that gets called whenever there’s a task that takes more than 50 milliseconds. In my function I maintain an array of all the PerformanceLongTaskTiming objects. Most of the other examples you’ll see print out task information to the console, but I want to maintain a list of all the tasks so I can decide what to do with them later.
This snippet is simple but presents a huge challenge: this code has to be executed before anything else in the page if you want to make sure to capture all long tasks. That’s a challenge for website owners, but it’s an even bigger challenge for RUM services that include their code via an external script. The "buffered" option will solve this problem in the future, but currently it’s not implemented.
The Long Tasks test page waits until window.onload to print all the long tasks. Currently, there are only two important properties of each PerformanceLongTaskTiming object:
startTime– when the long task started (number of milliseconds since navigationStart)duration– how long the task took in milliseconds
There are several other properties that will provide valuable information down the road:
name– Right now this is always “self”, but in the future will provide information about the origin of the long task. See the spec for a list of possible values.attribution[0].name– First let me point out that attribution is an array of TaskAttributionTiming entries, but the length will always be one for the foreseeable future. For now, attribution[0].name is always “script”. In the future, this will identify information about layout, paint, etc.attribution[0].containerSrc– In the future, this is where you would see information about thesrcof the container for the long task, but for now it’s null.
It’ll be critical to get information about more than just “script” in future implementations of the Long Tasks API, and knowing the src will help developers identify the cause of long tasks. A few other improvements are highlighted by the Long Tasks test page. This test page contains an inline script that loops for 400ms and an external script that loops for 1000ms, but most of the time those long tasks aren’t shown. It seems like this is a race condition in the onload handler. Adding a 10ms setTimeout correctly shows all the long tasks as shown in the Long Tasks with setTimeout page.
Looking at the Long Tasks with setTimeout page we typically see one entry for ~1400ms, rather than two separate entries. This is particularly surprising since the page has a 400ms task from an inline script, and a 1000ms task from an external script. The fact that these are combined into one PerformanceLongTaskTiming object limits the ability to diagnose the source of long tasks.
This is an early look at the Long Tasks API so it’s not surprising that there are pieces still to come. As of today, the main piece of information that’s available is the total long task time for “script”. Even though that’s a small part of what this spec will eventually provide, it’s still very valuable. I’ve started tracking this in RUM and will be watching it for indications of when JavaScript execution grows unexpectedly. I’ll also be watching the implementation in Chrome and other browsers so I can take advantage of other new features as they roll out. I’m confident that this information will be instrumental in helping developers track the presence and cause of slow rendering and jank in their websites.