

Felix Hassert @ffilex is developing Web software since 1999. He is Director of Software Development and Operations at Sevenval in Cologne, Germany, where he works on the Web performance and security platform wao.io.
The rest of the year, he follows his ferndrang to be as far away from home, work and keyboard as possible.
This year was HTTP/2’s third birthday. Support of h2 in browsers and Web servers is pretty good. Nowadays, with a TLS certificate at hand using h2 is not much more effort than flipping a switch. All major Web servers like Nginx, Apache httpd or IIS have built-in support. Auxiliary software like HAProxy or Varnish/Hitch do so, too.
That’s great! We get multiplexing, stream priorities, HPACK and all the other h2 awesomeness we see in slide decks – whatever they do…
Multiplexing, Streams, Frames and Priorities
The original sin of HTTP/1 was head-of-line (HOL) blocking. In a TCP connection, there could only ever be one outstanding HTTP request. Until the client had completely downloaded the response payload, it couldn’t tell the server what to serve next. That was a waste of time, because the server could use the download time to rummage through its archive to retrieve some dusty content.
h2 uses multiplexing to solve the HOL problem: every request and response is chopped into small frames. A request-response round-trip is a “stream” and has a number. Every frame has its own number plus the stream number. These frames can be sent in either direction interleaved with frames of other streams. The aim here is to utilize as much of the TCP bandwidth as possible. Less waiting, more data transfers!

To complicate things a little, h2 features stream priorities and dependencies. A stream can be assigned a weight and a parent stream. This provides browsers a means of telling the server the preferred order of data ingestion, optimized for page rendering. (Actually, this is a solution to a self-made problem: When all requests can be submitted at once, responses compete for bandwidth.)
A strange waterfall
We regularly host the #cgnwebperf meetup at Sevenval in our Cologne office. This summer, I was preparing slides for my talk “h2 turns 3” (our blog has a summary and pictures of cool guys with Kölsch). I did some research on how h2 actually does any good, and was buried in waterfall charts when I came across a strange one.
There are two requests standing out at the tip of the waterfall: A CSS (green) and a JS file (orange).
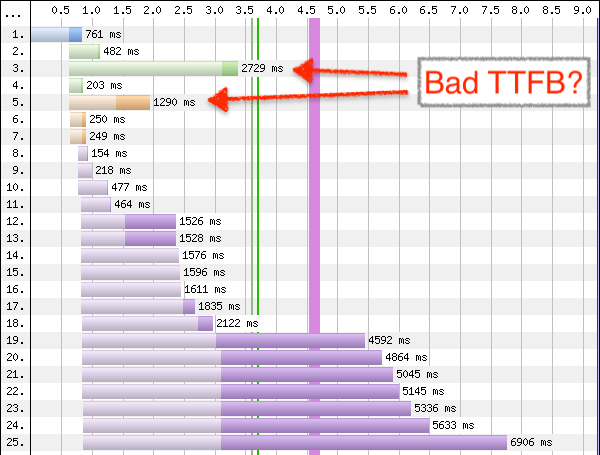
The vertical left side is typical for h2 waterfalls – all the requests (after the HTML document was loaded) start almost at the same time, with some of the <head> resources a small step ahead of the pack. Due to throttling configured in WPT, the download takes some time (the bold, right parts of the request bars). But there seems to be a lot of think-time (pale, left parts of the bars). The TTFB for some responses amounts to several seconds! Is the server responding slowly?
Not at all! In this setup, a TCP balanced Nginx terminates h2 and sends all requests through a Varnish cache. Almost all responses here were cache hits.
BTW, it’s a good idea to run a reverse proxy or cache like Varnish behind your h2 layer in order to protect your application servers. In HTTP/1, the HOL blocking and the six-connections-per-host rule resulted in a “cooperative throttling” behaviour: Expect no more than six simultaneous requests from any one client (without sharding…). With h2, clients don’t hold back, there may easily be 50 or more requests coming it at once.
But still, if Varnish serves everything so fast, why do we have 2.8s TTFB for the CSS?
Bad Buffers
As I mentioned before, in this setup nginx is deployed behind a load balancer. We use HAproxy in TCP mode. While this is easy to setup and probably done everywhere, it silently introduces a new TCP buffer:

The cache spits out payload as quickly as possible. In theory, the h2 server inspects its buffer and sends out data frames with the highest stream priority first. In practice though, the hop to the load balancer foils that feature: As long as its TCP buffer is not completely filled, the LB will accept more data from the h2 server. This quickly drains the h2 buffer. From there on, the h2 server’s stream prioritization does not work anymore!
This yields surprising effects. And unfortunately it is not so easy to cope with. (@kazuo has explained this kind of problem in more detail in his slides).
TCP HOL Blocking
Back to our strange waterfall. Reading h2 waterfall charts can be a bit tricky. One has to keep in mind that this ingenious visualization maps the client’s view. The 2.8s TTFB is not a slow server response. Inspecting the Date headers of the responses showed that every response for this page view was generated in the same second.
But a second is a long time. In this case, the CSS was about 80ms late to the party (because an upstream revalidation was necessary). That was more than enough time for Varnish to fill up all downstream buffers. TCP buffers are serialized, FIFOs. The client has to download the large images before it can even start with the important CSS.
Although the h2 protocol has solved the HTTP head-of-line problem, it still suffers from TCP HOL blocking. We have to wait for HTTP/3 to solve this, too.

The Sleepy Images Experiment
To validate the theory and as a fun way to workaround the problem, we have conducted an experiment that we have called Sleepy Images:
We delay all image responses in Varnish by a couple of milliseconds to make sure the (more important) JS and CSS content will slip into the h2 response buffers first. (It’s easier to slow down someone else’s cache hits than speeding up your own…)
Varnish has a module interface, and we have used vmod_sleep to hold back images responses. We only delay image cache hits, because misses will be slow enough on their own. The VCL snippet looks like this:
import sleep;
...
sub vcl_deliver {
    if (resp.http.Content-Type ~ "^image\/" && obj.hits > 0) {
      sleep.sleep(200ms);
    }
    return (deliver);
}
Favoring JS over images means favoring First Interactive over Speed Index (as long as the early images are over-the-fold). Let’s take a look at another waterfall chart. In the page view on the left, we see the same problem of seemingly large TTFB for JS files (brown). The images (purple) are large, so downloading them takes time.

With sleepy images, all the JS files suddenly look fast. What is the effect on the WPT indices?

The First Interactive is way better, because all the scripts can be executed earlier. Of course, holding back images for 200ms has its cost. In fact, the costs are fixed, because the images all sleep at the same time. The Speed Index goes up by about 200 and a bit points. Compared to the gain in script loading, this seems to be a fair deal.
Summary
The takeaway here is that HTTP/2 does not magically solves our problems – it creates new problems. We should be aware of this, when deploying h2 on our site. The concurrent load of browsers requesting all assets at once may hit your application servers. Hidden buffers may hurt your WPT numbers. Features like multiplexing and prioritization may not work as expected. And h2 waterfall charts are tricky to read.

Most h2 servers do not really multiplex response data frames (h2o is an exception). This is a valid choice for most file types. However, it makes HOL blocking effects worse (and reduces the utility of progressive JPEG). Often, a bunch of response header frames from many streams is sent out together (multiplexed). But the response data frames are then sent one stream after another (not multiplexed). That creates the typical h2 waterfall charts that have left-aligned requests and also left-aligned TTFBs in many cases. However, the TTLB looks much like in HTTP/1, because a slow connection stays a slow connection even with better TCP utilization.