

tl;dr: I’m currently working on an open source backend RUM tool called Basic RUM. The project is still at its concept stage and is helping me answer some questions at my full-time job. An alpha version is planned for the first quarter of 2019 but I’ve decided to spread the news earlier because I’ve noticed interest at different web performance meetups. In case you’re interested you may check this repository: https://github.com/basicrum/backoffice
Motivation
At some point I decided that I would like to advocate web performance at my workplace, but there was no open source tool available that I could just install and use. I’ve spent about a year learning how to collect RUM data and generate meaningful diagrams and I am still learning and improving. This has been a really slow process and I’ve spent many weekends trying to figure out various problems. Eventually I had something working and I considered building a SAAS product but since I didn’t really want to go in this business I decided to follow the example of Phillip Tellis (@bluesmoon the creator of Boomerang JS) and create something that is open source. It could save time and money for other enthusiasts like me. Also, I’m not saying that what I am building is the next SpeedCurve, mPulse or other professional monitoring software – my goal is to build a tool that enables people like me, who work in small companies, to have a smooth start and perhaps later decide to switch to a paid professional tool.
The beginning
About 2 years ago I became interested in web performance optimizations. It all started from a personal project that I tried to optimize according to the Google Pagespeed Insights recommendations. It was a really good experience and I learned some new tricks. After a while, I decided to draw attention to web performance optimizations at my full-time job but I wanted to do it in a more professional way because this was still new for our mindset, the idea had to compete with other exciting ideas, and I didn’t want to create a regression which could cost us money, and I also really wanted to raise the topic about data-driven decisions. That is how I decided that we need a RUM tool!
The first thing I did was look at the tools currently available on the market. They looked really good and professional but a bit pricey and nobody around me was willing to pay any amount of money for an idea whose potential was still very questionable and unclear. At that moment I started researching what we could do with the free and open source RUM projects that were available.
Research
My conclusion was that there were various components but no complete RUM solution. Here are some components that I have found:
- Boomerang JS – a client side JavaScript library that collects performance metrics from the visitor’s browser and sends it to a remote endpoint.
- Boomcatch – a standalone, Node.js-based beacon server for Boomerang, the foremost client-side RUM library.
- Redash – a query editor for SQL queries, visualizations and dashboards.
- PerfCascade – a TypeScript/JavaScript waterfall renderer.
Technology stack
At this point you might think that I’ve simply combined all the components mentioned above but I took a different direction. I decided to use Boomerang JS and build a backend/back-office system of my own. The main goal was to build something for enthusiasts like myself and make the time from the start of collecting data to generating their first performance diagram as short as possible. I chose to use PHP (Simfony 4) as my programming language, MySQL as data storage, and Plotly JS for visualization. I also converted some of the existing JavaScript libraries to PHP in order to have better control in case I want to implement something new. There are 2 simple reasons for this choice of technology – I am perfectly comfortable with PHP and MySQL and I am surrounded with excellent developers who work with the same technologies, which makes my life easy when I seek help.
How it works
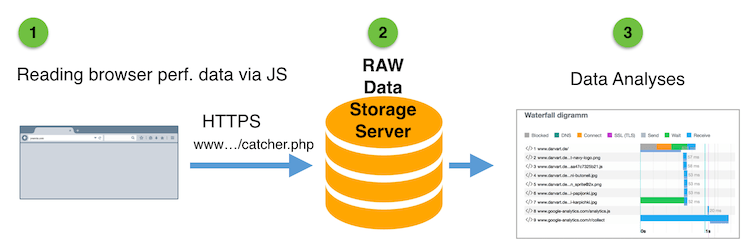
Capabilities
During the few past months I’ve tried to answer some interesting questions with Basic RUM and so far I’ve built a user interface which allows me to:
- estimate potential revenue gain when performance improves
- filter different performance metrics (Time to First Byte, Time to First Paint…)
- compare different time periods
- filter by User Agent, URL and Page Type
- calculate and display median values
- show density (helpful when comparing different time periods)
- define time buckets size
- generate waterfall diagrams
Let’s look at some examples:
1. Revenue estimator

A revenue estimator that calculates potential revenue gain when Time to First Paint is reduced by 0.2 sec, 0.4 sec, 0.6 sec, 0.8 sec and 1 sec. It predicts what the conversion rate is going to be when the bounce rate decreases, and calculates potential revenue based on an average order value.
2. Compare periods
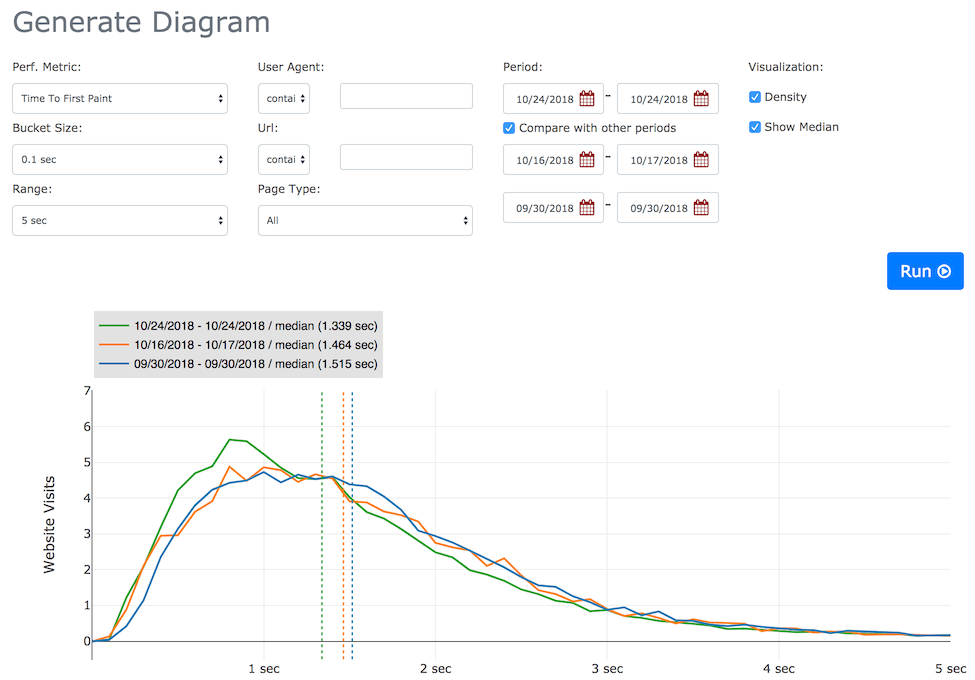
This feature could be useful in case we want to check how we’ve improved performance between releases. In this case I have chosen 3 periods:
- No change – TTFP median 1.515 sec
- Reduced JS and CSS – TTFP median 1.464 sec
- Brotli compression enabled – TTFP median 1.339 sec
3. Waterfall diagram viewer
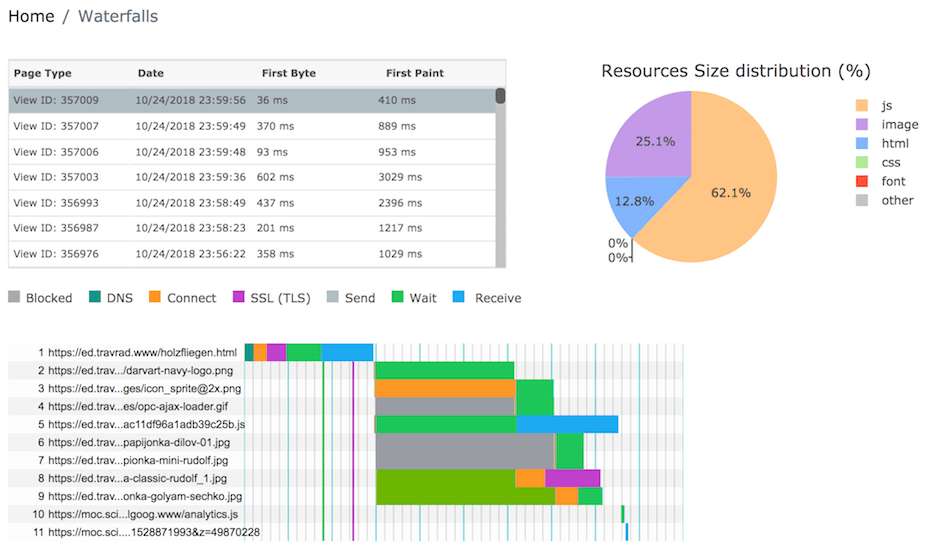
This feature is useful when we want to look at waterfall diagrams and trace performance bottlenecks. We can choose from page visits and we can also see a summary-of-resource-size distribution.
4. Agent Builder
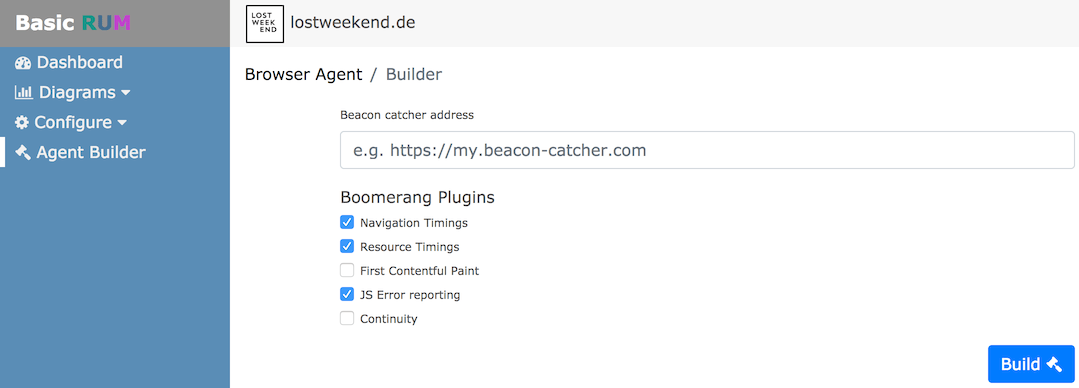
I’ve also found it very helpful to have a page where I can build my own compilation Boomerang JS + Boomerang Plugins.
Challenges
1. Learning curve
I can only talk from personal experience but I have the feeling that there are some things that apply to me and to most people who would like to start with performance optimizations and performance monitoring. The learning curve could be a bit slow if you have to deal with statistics, data visualization and so on for the first time. I believe that the onboarding process will be much easier for those who come from data science.
2. Database performance and storage size:
So far I’ve been using MySQL as my database engine and I am not sure this is the right choice, but for now I am trying to keep it simple and create something that would be understood by a broad audience. I already see some signals and flaws in using MySQL. I am conducting my experiments on a website that receives some 50,000 visits daily and I collect information on navigation timings, resource timings and mobile networks. The data that I’ve collected from this website over the period of one month is taking up about 50 GB in MySQL. I’ve managed to reduce the size by 40% by normalizing the table structure and enabling MySQL table compression but I still find this unsatisfactory especially when I develop and do experiments in my local environment because this is a lot of overhead for a laptop/workstation. I’ll be working on a cleverer database design and thus significantly reduce database size. I am also currently looking at a time-series database called Prometheus and I will experiment and see if this database can boost development and help serve system users’ needs better.
3. Data retention
For me the question of data retention is a bit unclear. Indeed it is a question that ought to be considered but might not be implemented in the best way possible in the beginning of the project. I might just keep fresh data only for the past 3 months and delete all older data, or try to archive old data and only restore it and do reports on it when necessary – but this is still an open question.
4. Browser bugs
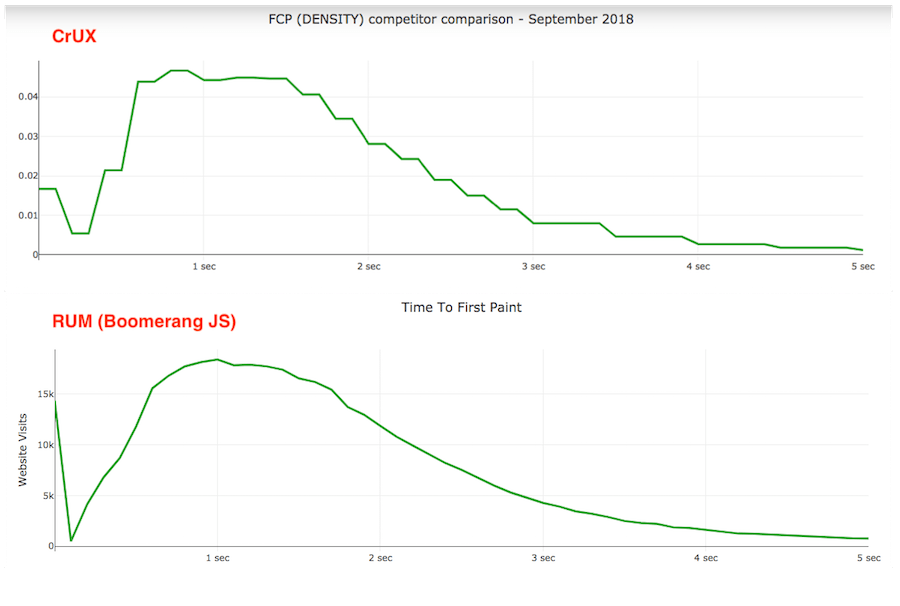
There are a lot of bugs. And I’ve had to filter tons of data. Before importing the data, I got a lot of negative or very high values for metrics like Time to First Byte, Time to First Paint, Redirect Time, DNS time, and so on. So browsers have a lot of bugs but I’ve also got a chance to compare my reports with CrUX for September 2018 and I’ve noticed good consistency for the Time to First Contentful Paint metric:
5. Bots also send beacons
When I looked at the RAW performance data, I noticed beacons from interesting user agents like Bing Bot, Google Bot and so on. I find this curious and we need to be aware that bots also send beacon data and that we have to estimate if we need to include them when building our reports.
In Closing
I really believe that there is interest and desire for an open source RUM tool and I am really excited to receive any kind of feedback (both negative and positive) which will help me clarify some concepts. I strongly believe that such a tool has a future and would be helpful for enthusiasts. Because I put so much faith in this project, I’ve decided to kind of leave my current full-time job (reduce my work hours to 20 per month) and dedicate the rest of the time to Basic RUM!