

Amiya Gupta (@amiyagupta) is a Web Performance Engineer at Microsoft. He has worked on making sites such as Microsoft.com and MSN.com load faster.
Introduction
We spend a lot of time measuring and analyzing the performance of our products using a variety of tools. But how much do we know about the performance of these tools themselves, and the observer effect they introduce if they’re slow?
Earlier this year I had the opportunity to make some contributions to the WebPagetest project to reduce its measurement overhead when running tests in IE and Edge.
Terms
WPT-ETW is a WebPagetest component used to record and serialize data about browser events. These include page lifecycle events (e.g. DOMContentLoaded) and networking events (needed to generate the waterfall). It runs while the browser is running a test and periodically passes chunks of this data in realtime to downstream WebPagetest components for further processing.
ETW (Event Tracing for Windows) is a technology that provides Windows applications a standard way to to instrument and record events. IE and Edge are extensively instrumented with ETW markers for all sorts of diagnostics including performance.
WPT-ETW uses the TraceEvent library to interface with ETW.
Problem & Methodology
We evaluate variance changes in our private WebPagetest instance using a couple of static, unchanging pages. The “simple” benchmark page consists of only HTML and images. The “complex” benchmark page adds in CSS, JS and a more complicated layout. Because the benchmark pages are not changing on a daily basis they help us isolate infrastructure issues that may affect the validity of our measurements including variance.
We noticed that WPT-ETW consumed a high amount of CPU. For example this ETW trace shows that WPT-ETW consumed 2502ms of CPU time, while the browser itself only consumed 542ms:
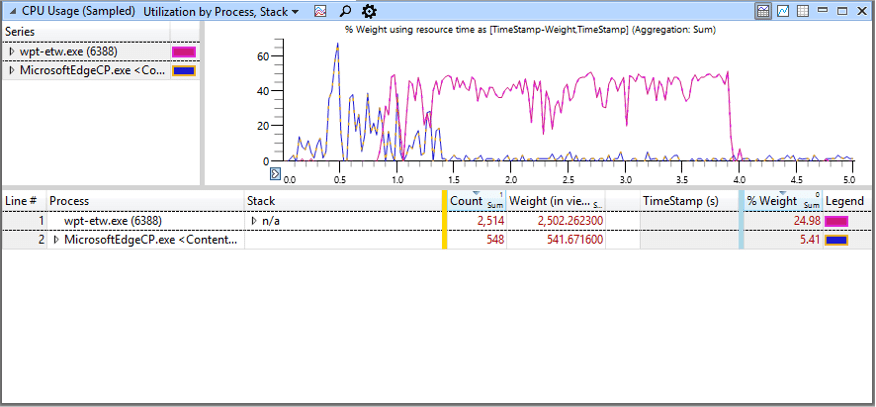
The other problem is that the graphs overlap, so the browser and WPT-ETW can both be in contention for the same CPU resources. We suspected this was also causing variance in our measurements. The Edge team had also called out WPT-ETW’s CPU consumption as being suspiciously high. Hence the goal was to minimize WPT-ETW’s CPU consumption during test runs.
Optimizations
1. Event filtering (PR)
The initial analysis revealed that WPT-ETW was processing tens of thousands of ETW events for each test and the vast majority were being discarded. Only about 0.1%-0.2% of the events generated during a test were needed, but the TraceEvent library was processing all of them. Fortunately the TraceEvent library provides the ability to filter for specific events by ID. Using this feature eliminated the need for TraceEvent to process irrelevant events and this reduced WPT-ETW’s CPU consumption.
2. Update dependencies (PR #1, PR #2)
Sometimes optimizing performance is simply a matter of upgrading your libraries to the latest versions. An upgrade to two of the libraries reduced CPU consumption by 2x on the simple benchmark page and 4x on the complex benchmark page (with optimization #1 as the baseline). The library upgrades also included some bug fixes which enabled the removal of some very expensive code to work around. Eliminating this complex code thrilled Patrick Meenan and reduced CPU time a further 50%-60%.
3. Use StringBuilder to reduce cost of string concatenation (PR #1, PR #2)
As ETW events are logged they are processed and serialized to JSON string. WPT-ETW uses a string variable named “events” as a buffer to store serialized event data before passing it to downstream components. Each serialized event was appended to the “events” string variable. Because C# strings are immutable, concatenation is an expensive operation that involves repetitive memory allocation. On some very heavy webpages the length of the “events” string reached 1.2-1.5 million at times.
The optimization was to use a StringBuilder instead. The StringBuilder was pre-allocated with ~2MB of memory (2 million characters) to ensure it would almost never have to be resized at runtime.
4. Eliminate string search (PR)
Because ETW executes at the system level, network traffic from executables other than the browser (including WebPagetest itself) could potentially end up showing up in waterfalls. There was a significant amount of CPU time being spent executing string searches for any local traffic going to the WebPagetest endpoint at http://127.0.0.1:8888 with the intent of filtering those events out.
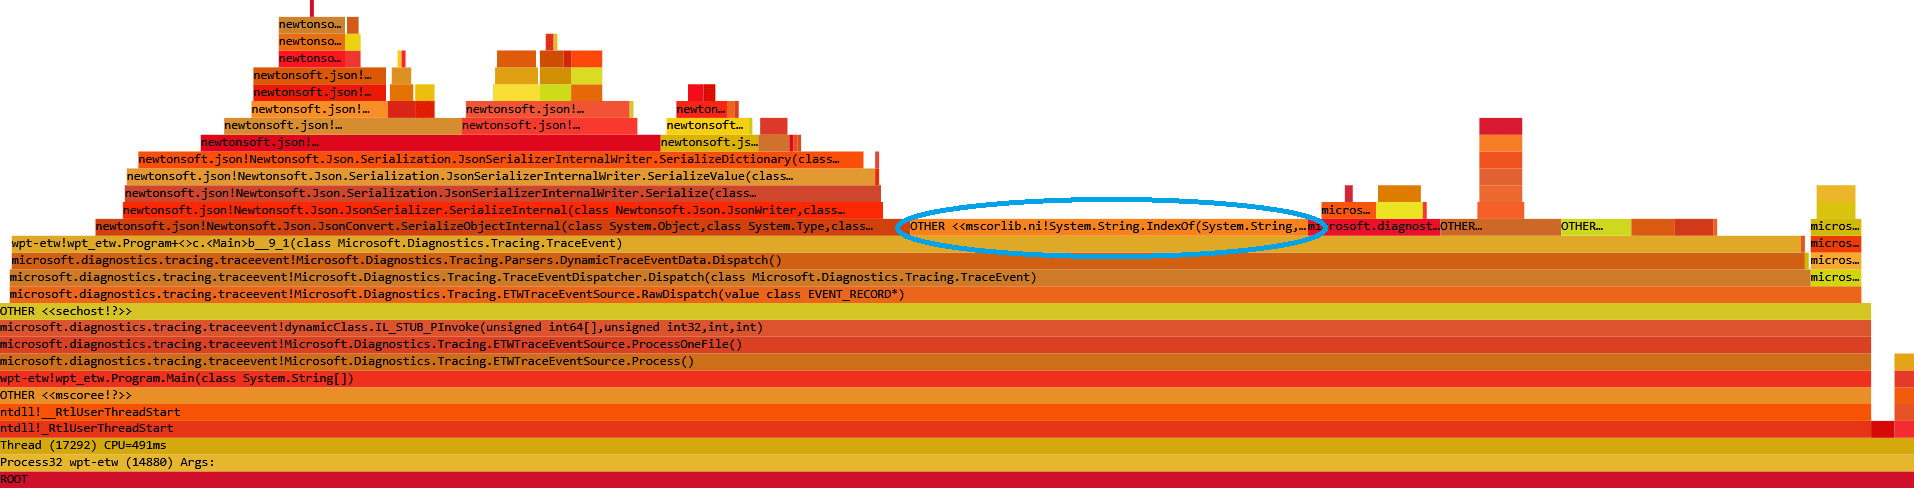
After adding some instrumentation it appeared this code never actually seemed to find a match. It turned out it had been added for an approach that was later abandoned and the string matching code could be removed entirely.
5. Warm up the Newtonsoft.Json serializer (PR)
WPT-ETW uses the Newtonsoft.Json library to serialize ETW objects into JSON for further processing by downstream WebPagetest components. The vast majority of time spent in serialization was in the first serialization because of the cost of warming up the DLL. Subsequent serializations were 2-4 orders of magnitude faster. The optimization was to execute a dummy JSON serialization earlier in the WPT-ETW executable. While this does not make the cost of DLL initialization any less expensive, the cost is incurred before the test starts, reducing contention with the browser. It’s like packing the expensive operations into the loading screen of a video game to ensure actual gameplay is smooth.
Before the change the very first serialization took >100ms:
Forwarding ETW events to http://127.0.0.1:8888/
To exit, hit ctrl-C or create the file C:\Repos\wpt-etw\bin\Release\wpt-etw.done
Serialized ETW event into 162 bytes of Json in 1044154 ticks (104 ms)
Serialized ETW event into 336 bytes of Json in 23028 ticks (2 ms)
Serialized ETW event into 160 bytes of Json in 16729 ticks (1 ms)
Serialized ETW event into 358 bytes of Json in 513 ticks (0 ms)
Serialized ETW event into 196 bytes of Json in 430 ticks (0 ms)
Serialized ETW event into 193 bytes of Json in 333 ticks (0 ms)
Serialized ETW event into 197 bytes of Json in 478 ticks (0 ms)
After optimization the first serialization dropped to 13ms:
Forwarding ETW events to http://127.0.0.1:8888/
To exit, hit ctrl-C or create the file C:\Repos\wpt-etw\bin\Release\wpt-etw.done
Serialized ETW event into 162 bytes of Json in 131536 ticks (13 ms)
Serialized ETW event into 204 bytes of Json in 22865 ticks (2 ms)
Serialized ETW event into 160 bytes of Json in 16410 ticks (1 ms)
Serialized ETW event into 143 bytes of Json in 324 ticks (0 ms)
Serialized ETW event into 145 bytes of Json in 276 ticks (0 ms)
Serialized ETW event into 193 bytes of Json in 280 ticks (0 ms)
Serialized ETW event into 191 bytes of Json in 436 ticks (0 ms)
Results
Implementing these optimizations reduced WPT-ETW’s CPU consumption dramatically, almost 90% (or sped up 9x depending on how you look at it). Variance also improved as a result of reduced contention.
| Page Type | Before | After | Delta (ms) | Delta (%) |
|---|---|---|---|---|
| Simple | 2739ms | 322ms | -2417ms | -88% |
| Complex | 6216ms | 691ms | -5525ms | -89% |
Conclusion
The impact of these improvements might seem short-lived given the recent announcement. However the higher level point about needing to pay attention to the overhead of our performance tools holds true regardless of the future direction of technology. It’s worth mentioning that Chrome has some ETW instrumentation of its own but WebPagetest does not rely on it.