

Annie (@anniesullie) is a software engineer with Google. She is passionate about building a better performing web for users across the globe. Her tenure as a Googler spans 15 years, with experience on the toolbar, docs, web search, and chrome teams. Annie currently works on performance metric development on Chrome. She lives in Michigan with her husband Doug and two sons, and enjoys tinkering with laser cutters, metal etching, and new cooking techniques.
Background
I work on Chrome’s Speed Metrics team. We develop Chrome’s top level performance metrics — the metrics that measure the performance of the web’s most key user experiences. For years, we’ve been working towards a metric that captures when the main content of the page has displayed, both in the lab and in real-user monitoring (RUM). We want to go beyond First Paint and First Contentful Paint, which measure when the page starts loading, and measure when the user can actually see the content of the page. This is a really tough problem, and over the past two years we’ve been working on a new approach. We’re really happy with the results! In Chrome 77, we released the Largest Contentful Paint (LCP) metric which we feel measures when the main content of the page is displayed. I wanted to give some background on the metric and how it was developed. The primary author of the metric is Max Gu.
What makes a good metric?
Over the years our team has discovered some guiding properties for good top-level metrics. Some of the properties are more important for lab use cases, and some are more important for real-user monitoring (RUM) use cases. Often the different properties are in tension, so we need to carefully choose which to prioritize. There are more details in the doc linked above, but here’s a quick overview:
- Representative. First and foremost, the metric must aim to measure something that is representative of a key user experience.
- Accurate. The metric should be accurate in measuring the user experience it aims to represent.
- Stable. The metric value doesn’t vary much on successive runs on similar input. This is most important for lab use cases, where reproducibility is key.
- Interpretable. The numbers the metric produces are easy to understand, especially for individuals without strong domain knowledge.
- Simple. The way a metric is computed is easy to understand.
- Elastic. A small change in the page being measured results in a small change in the metric, and vice versa. This is most important for lab metrics, where a constrained environment can amplify the lack of elasticity.
- Realtime. It should be possible to compute the metric in realtime. This is most important for RUM use cases, where the metric needs to be computed in time to report its value to the page.
- Orthogonal. Multiple metrics shouldn’t aim to represent the same user experience.
What did we aim to measure?
The first property is most important for a top-level metric — we really want it to be representative of a key user experience. For pageload, we believe there are three key events:
| When did the page start loading? | When was the main content of the page visible? | How interactable is the page during load? |
|---|---|---|
 |
 |
 |
| We use First Contentful Paint (FCP) as our metric forthis. | This is the key question we wanted to answer with a new metric. | We use Time to Interactive (TTI) as our metric in the lab, and First Input Delay (FID) as our metric in the wild. |
We wanted a metric that would represent the middle event in the graphic: when is the main content of the page visible to the user?
Prior work
There are already some metrics that aim to represent this part of the user experience:
Speed Index
Speed Index is, approximately, the average time at which visible parts of the page are displayed.
There are a lot of great things about Speed Index. It does a great job of approximating when the main content is displayed, so it is accurate. Using an average time makes it stable and elastic. Since it reports a point in time during page load, it’s interpretable, in that it’s easy to understand that it’s reporting approximately when the main content was displayed.
But there are some downsides. First, the metric definition is not simple. More importantly, it’s not realtime — it can’t be computed quickly without overhead, so it’s not available for RUM in any major browser. This is the major limitation of Speed Index.
First Meaningful Paint (Deprecated)
First Meaningful Paint was an experimental metric that attempted to capture when the main content loaded in a RUM context. It’s defined as the time of the paint that follows the biggest layout change during page load.
Since it’s reported as a point in time during the page load, it’s interpretable. And it’s available realtime.
But the metric definition is not simple. And in about 20% of cases, we see strange outlier results, so it is not accurate, which is a big problem. This is hard to fix because it’s not clear why the biggest layout change wasn’t laying out the main content in those cases.This is the reason the metric has been deprecated.
Goals for a main content painted metric
We always care first and foremost that a metric we develop will be representative and accurate.
Because there is already a lab metric available, it was critical to us that the metric be available for RUM. So the next highest priority was that the metric be realtime.
Since we want web developers to be able to act on the metric, our next highest priority was that it be interpretable. So we wanted the metric to report a point in time after navigation.
Finally, we hope that the API can be polyfilled and/or standardized so that it is available across browsers. This means that the metric definition should be simple.
Implementing a metric
With our goals in mind, we had an insight. We can get paint events in realtime, and we know whether they’re in the viewport visible to the user. Could we use them to build a main content metric with the properties we needed? We started by brainstorming possible metrics:
- Largest image paint
- Largest text paint
- Largest image or text paint
- Last image paint
- Last text paint
- Last image or text paint
We implemented each of these as candidate metrics, and built a tool that shows filmstrips of the site loading along with each candidate metric, and the paint rectangles showing what painted.
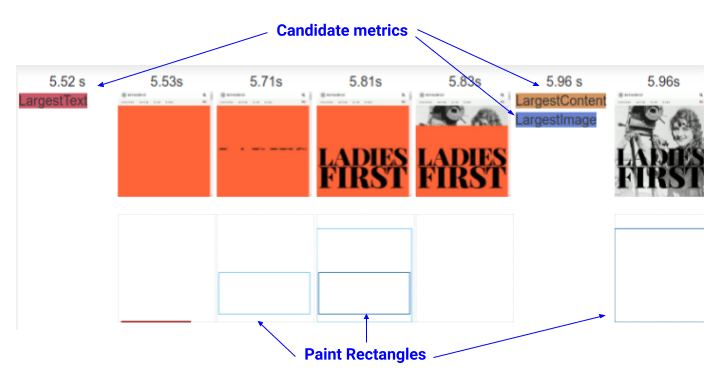
Our team looked at hundreds of filmstrips, checking which metric most closely aligned to the main content being loaded, and what the outliers looked like. We used our best judgement to understand the accuracy of the different metrics. The best metric of the bunch was clearly the largest image or text paint, or Largest Contentful Paint.
Not Quite So Simple
It was really exciting to have a simple metric that could be measured in realtime, but we weren’t done yet. Although the largest image or text paint was the best metric of the bunch, there were some problems it didn’t handle.
Body background images
Body background images are often large images which aren’t really pagecontent. In this example, the background image loads before the main content. Here are a few more examples of problems with body background images as the Largest Contentful Paint. We invalidated body background images as candidates for Largest Contentful Paint for this reason.
 |
 |
 |
| If we include body background images as candidates for largest contentful paint, Largest Contentful Paint occurs here. | If we do not include body background images, Largest Contentful Paint occurs when the main content loads (the candidate used is highlighted in yellow). |
Text paints
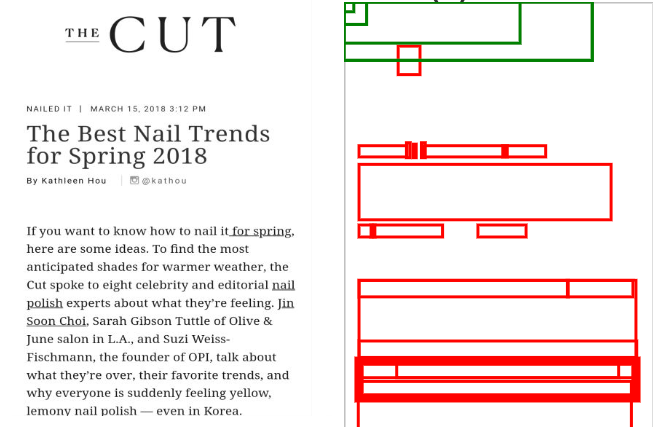
Paint events for blocks of text might not look like what the user expected; since there can be links and text styles inside a paragraph, it might have multiple paints. Below is an example from our tool; the paragraph on the bottom left breaks up into multiple paint events even though it appears to a user as a single element on the page. So text paints are aggregated to block-level elements containing text nodes or other inline-level text element children.
And what about web fonts? Since we’re measuring when the content of the page is displayed, we use the earliest displayed font.
User Input
Imagine an infinitely scrolling page like a news feed or timeline. As the user scrolls, new elements are painted in the viewport and the Largest Contentful Paint may be constantly updated, making it report higher and higher values. It doesn’t make sense to report such a page as slower than one the user didn’t interact with. So the Largest Contentful Paint is only reported up until a user input that could affect the visible content (click, tap, scroll, etc).
Evaluating the metric
After looking at the metric on hundreds of filmstrips, we were convinced of its accuracy. But we wanted to dig deeper.
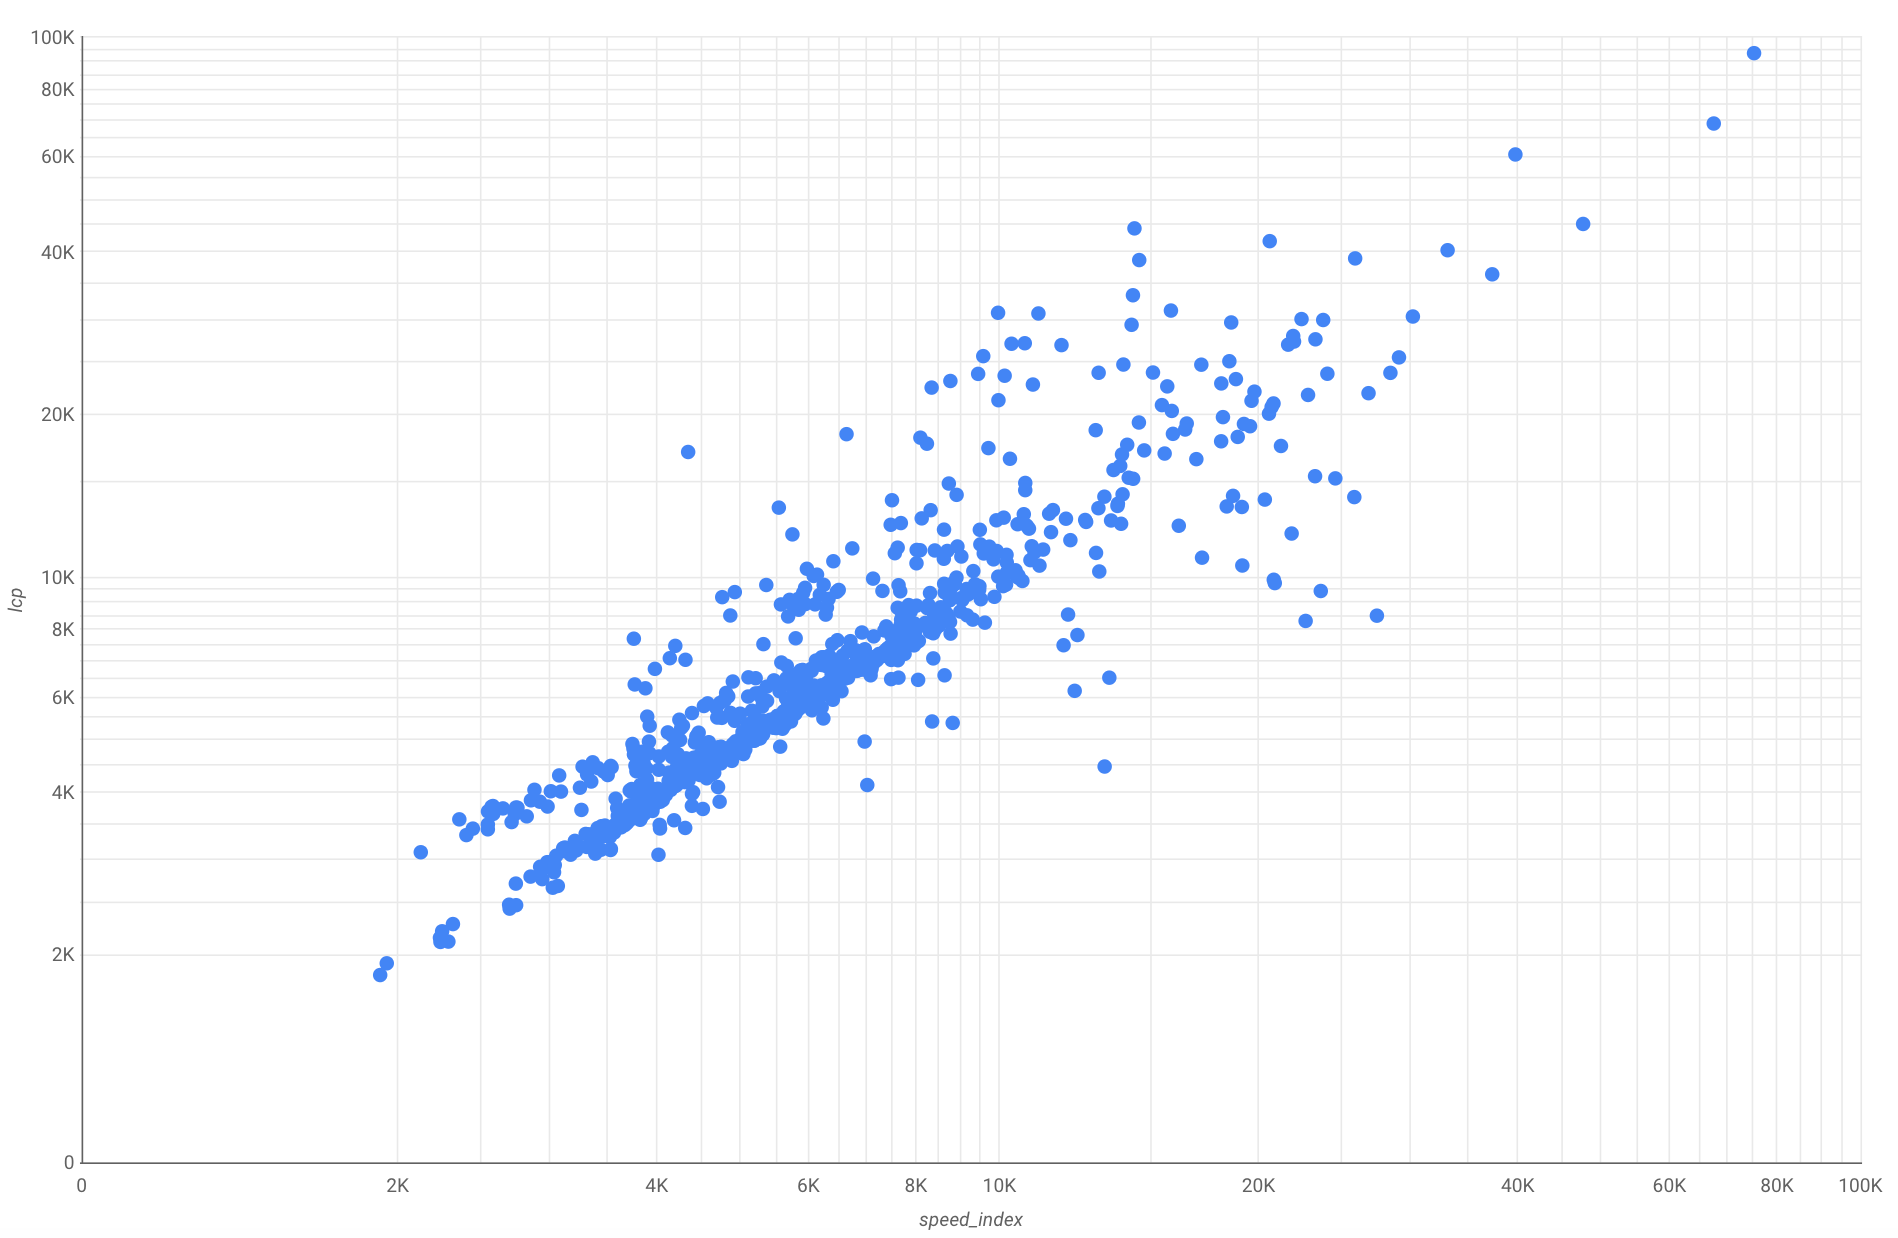
Largest Contentful Paint is measured in the HttpArchive on over 4 million sites, both desktop and mobile. We dug into the data to see how it compares to other performance metrics. Since we know that Speed Index is a high quality lab metric, we wanted to understand if Largest Contentful Paint could serve as a RUM replacement. So we first looked at how well Largest Contentful Paint correlates to Speed Index, and the answer is that it correlates very well!
On mobile, there is a 0.83 correlation:
And on desktop, there is a 0.87 correlation:

So we do feel that Largest Contentful Paint is a good RUM alternative to Speed Index.
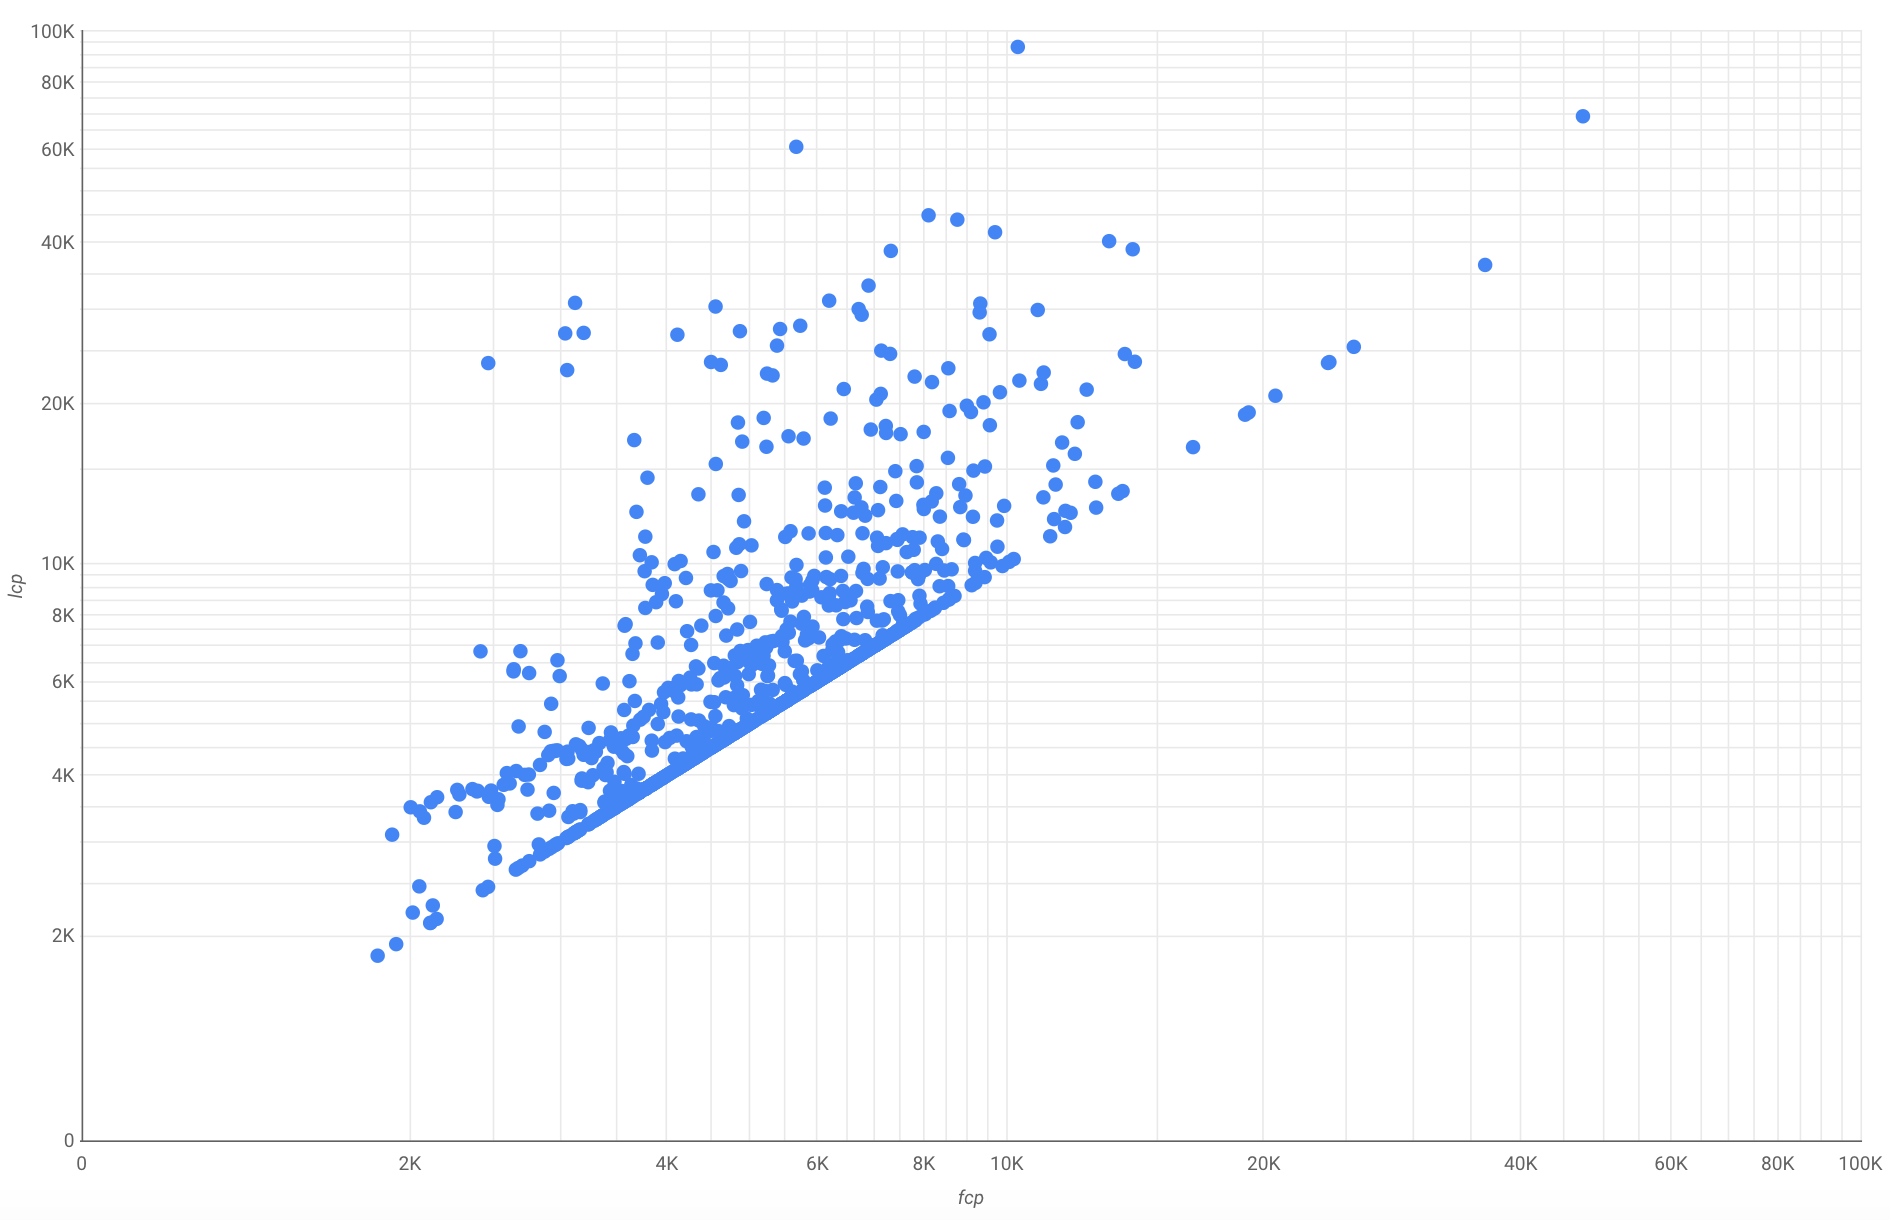
But what about orthogonality? Is Largest Contentful Paint really all that different from existing RUM metrics like First Contentful Paint? We dug intothat too. The correlation is much lower (0.68 on mobile and 0.73 on desktop). And if you look at a scatter plot, you can see a few things:
- Since the First Contentful Paint is, well, the first, the Largest Contentful Paint never occurs before it.
- Indeed for some sites, the First Contentful Paint is also the Largest (the diagonal line).
- But for the rest of the sites, the Largest Contentful Paint is unrelated to the first contentful paint. So the metrics are indeed orthogonal.
The end result
- We’re really happy with the accuracy we see looking at filmstrips of Largest Contentful Paint; we feel it gives a good representation of when the main content of web pages loaded.
- Largest Contentful Paint correlates well with Speed Index over a large corpus of sites. So we think it makes a great RUM alternative to Speed Index!
- Largest Contentful Paint shows much less of a correlation with First Contentful Paint, which is what we were hoping for as the two metrics aim to measure distinct parts of the user experience (when the page content starts to display vs when the main content is visible).
Try it out!
Largest Contentful Paint is available in Chrome as of Chrome 77. Check out the official documentation to get started.If you want to dig deeper, check out the explainer
and specification.