

Robin Osborne (@rposbo) is an experienced Performance Principal, VP engineering, Head of Development, Software Development Manager, Team Leader, Architect, Analyst, and Developer who has implemented, designed, supported, and defined development strategies for high availability, highly transactional, global systems.
He specialises in the design and development of Web Performance Optimisation setups, Optimisation for China, and DevOps pipelines in AWS and Azure.
Robin also creates and delivers training courses, and speaks at meetups and conferences on subjects ranging from being a professional developer or technical manager, Web development and performance optimisation, through to Azure development best practices and Chatbot design and development.
He's an absolute nerd for automating all the things in order to instead spend his time hunting down London's best coffee and teaching his daughters to play video games.
Performance Optimization is Great
Sure, optimising performance for increasing profit is great. It’s great for improving the experience for your end users too.
No doubt you can navigate DevTools like a champ, and you know your progressive jpeg from your interlaced png.
But what about saving the planet?
You heard me right, buddy. You can put your extensive optimization powers to even better use: helping save the environment! You’ll be a cross between Steve Souders and Captain Planet! Captain Performance! And who wouldn’t want to see that?

As web performance specialists like yourselves know, bloated websites with big images, over complicated DOMs, complex Javascript, and a huge guest list of 3rd parties and their uninvited chums, all mean the overall Page Weight of your beloved website creeps ever higher.
The incredible HTTP Archive 2019 Almanac has a chapter dedicated to page weight, and says that in 2019 the median page weight was 1.96MB, with the 90th percentile pushing an almighty 6MB. Bravo, those upper 10% serving sites bigger than 6MB; quite an achievement.
If 6MB is no problem for you on your 4/5G, gigabit ethernet, or fibre optic broadband, then you’re one of the fortunate ones. Looking at the results of Cable.co.uk’s Worldwide Broadband Speed League for 2019, we can see that although an average user in the United States can likely download a 5GB movie in 20 minutes, it would take the average user in Brazil over 2 hours.
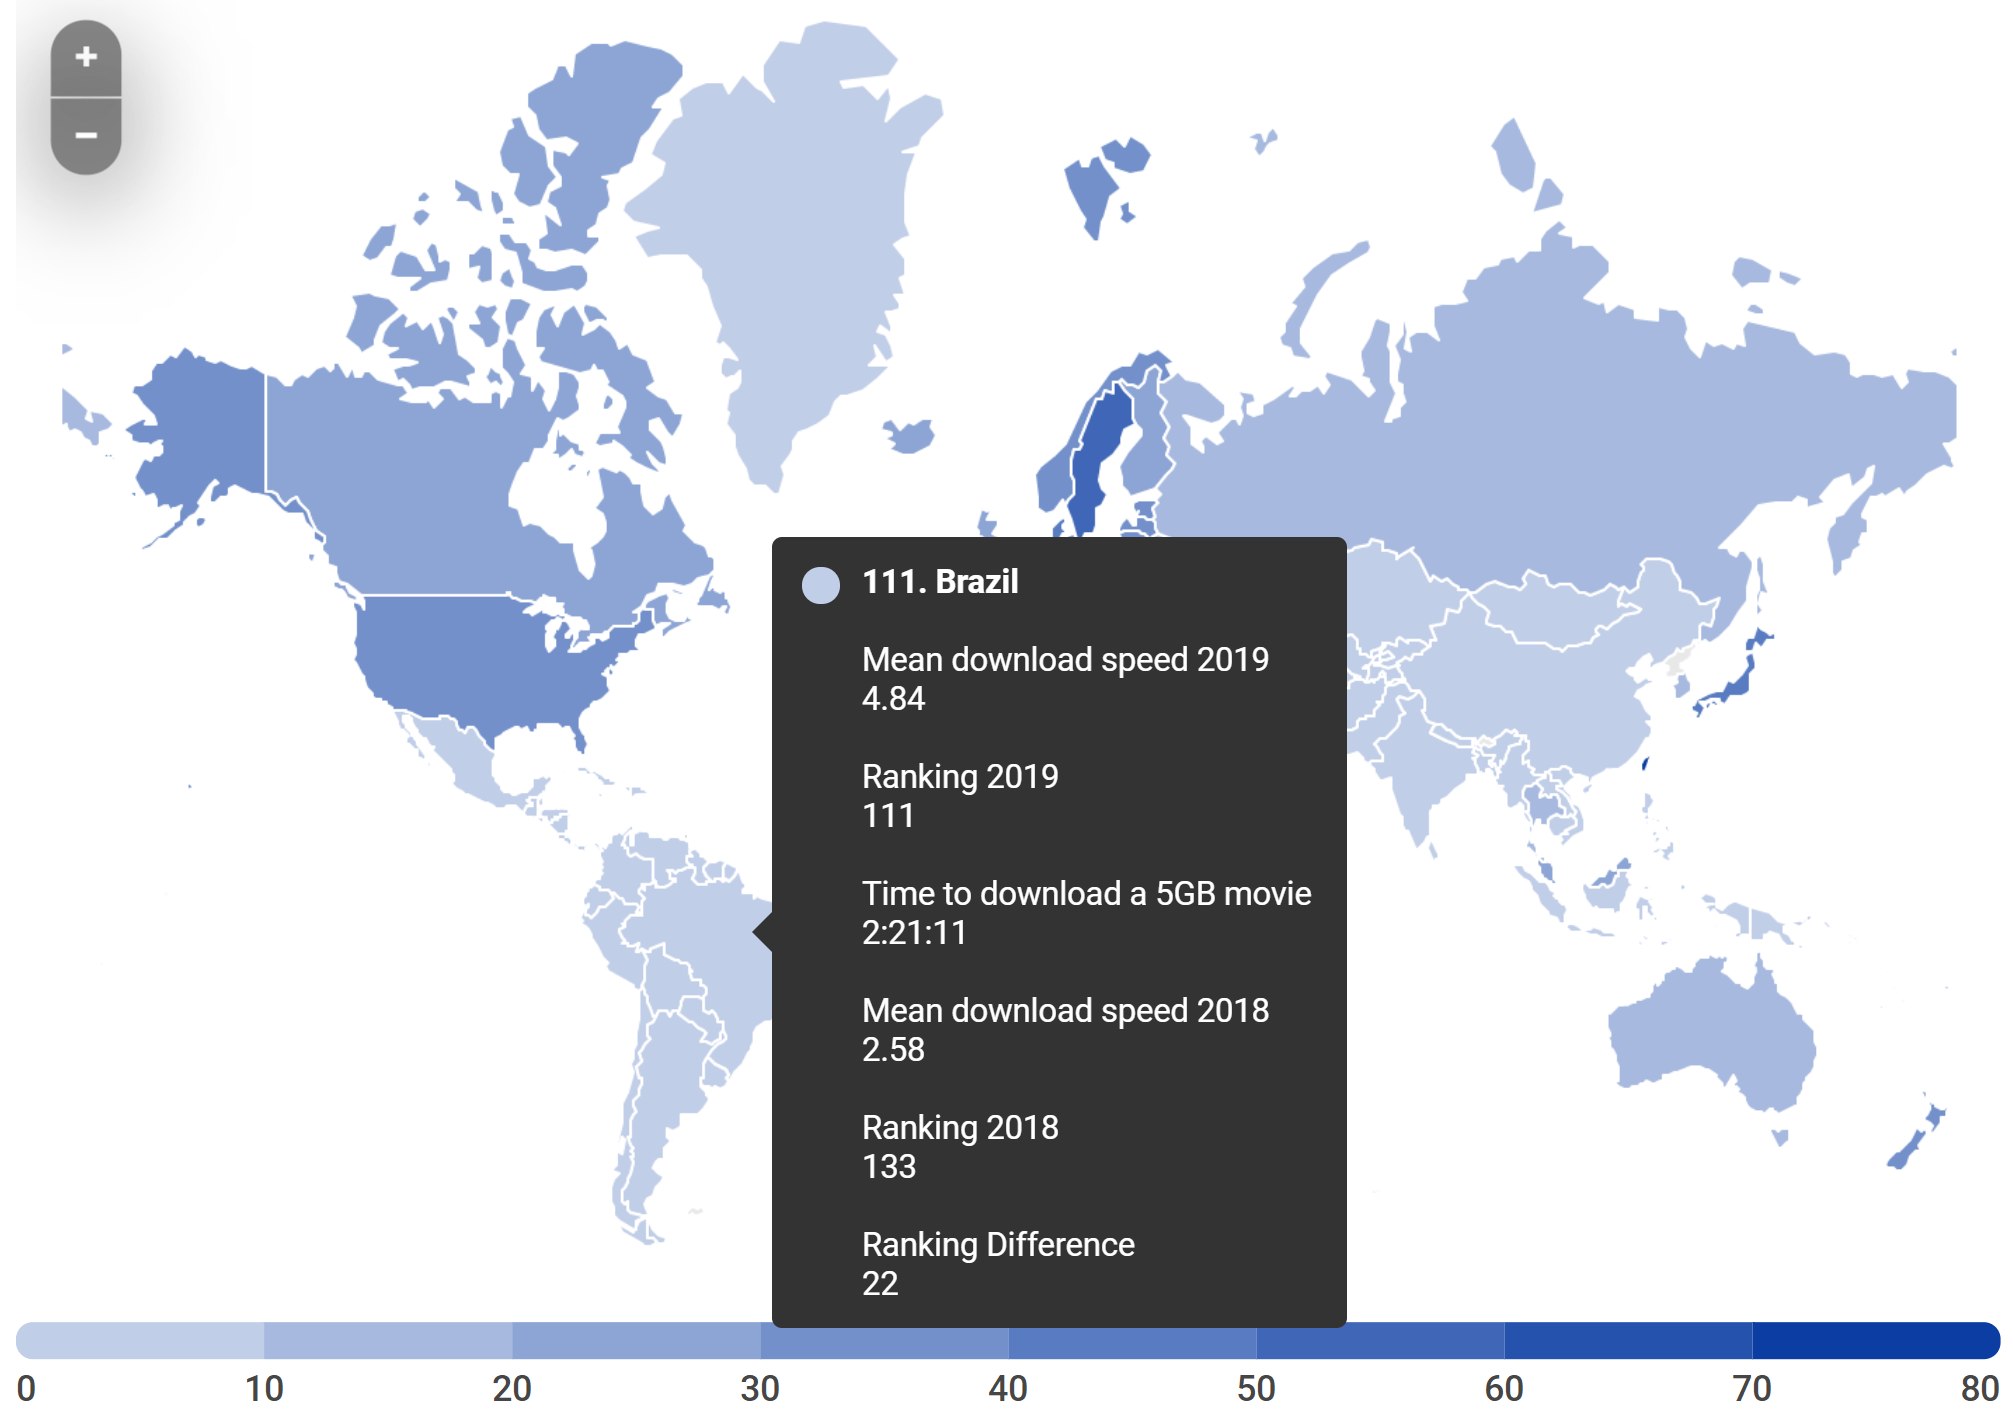
SpeedTest.net’s Global Index has Brazil performing better, however if you’re online in Venezuela then both these reports – and Akamai’s 2017 rankings – will have you waiting patiently to see a slow-loading sad face emoji.
So many of us live in our tech bubble – especially web perf nerds like us – and it’s sometimes sobering to realise how lucky we are.
Optimizing for speed, customer experience, and the associated revenue increase is the main driving force in website optimization.
Show Me The …buffering… Money!
That tech bubble expands further than just performance, and an ability to binge on 4K Netflix without …buffering… a blip; every byte has an associated cost, and many people are not fortunate enough to have an affordable data plan with their provider.
As shown by Tim Kadlec’s extremely informative site, WhatDoesMySiteCost.com, the cost of the average (i.e. 1.96MB) web page is around $0.24 USD for a user in Canada but only $0.03 for a user in the United Kingdom.
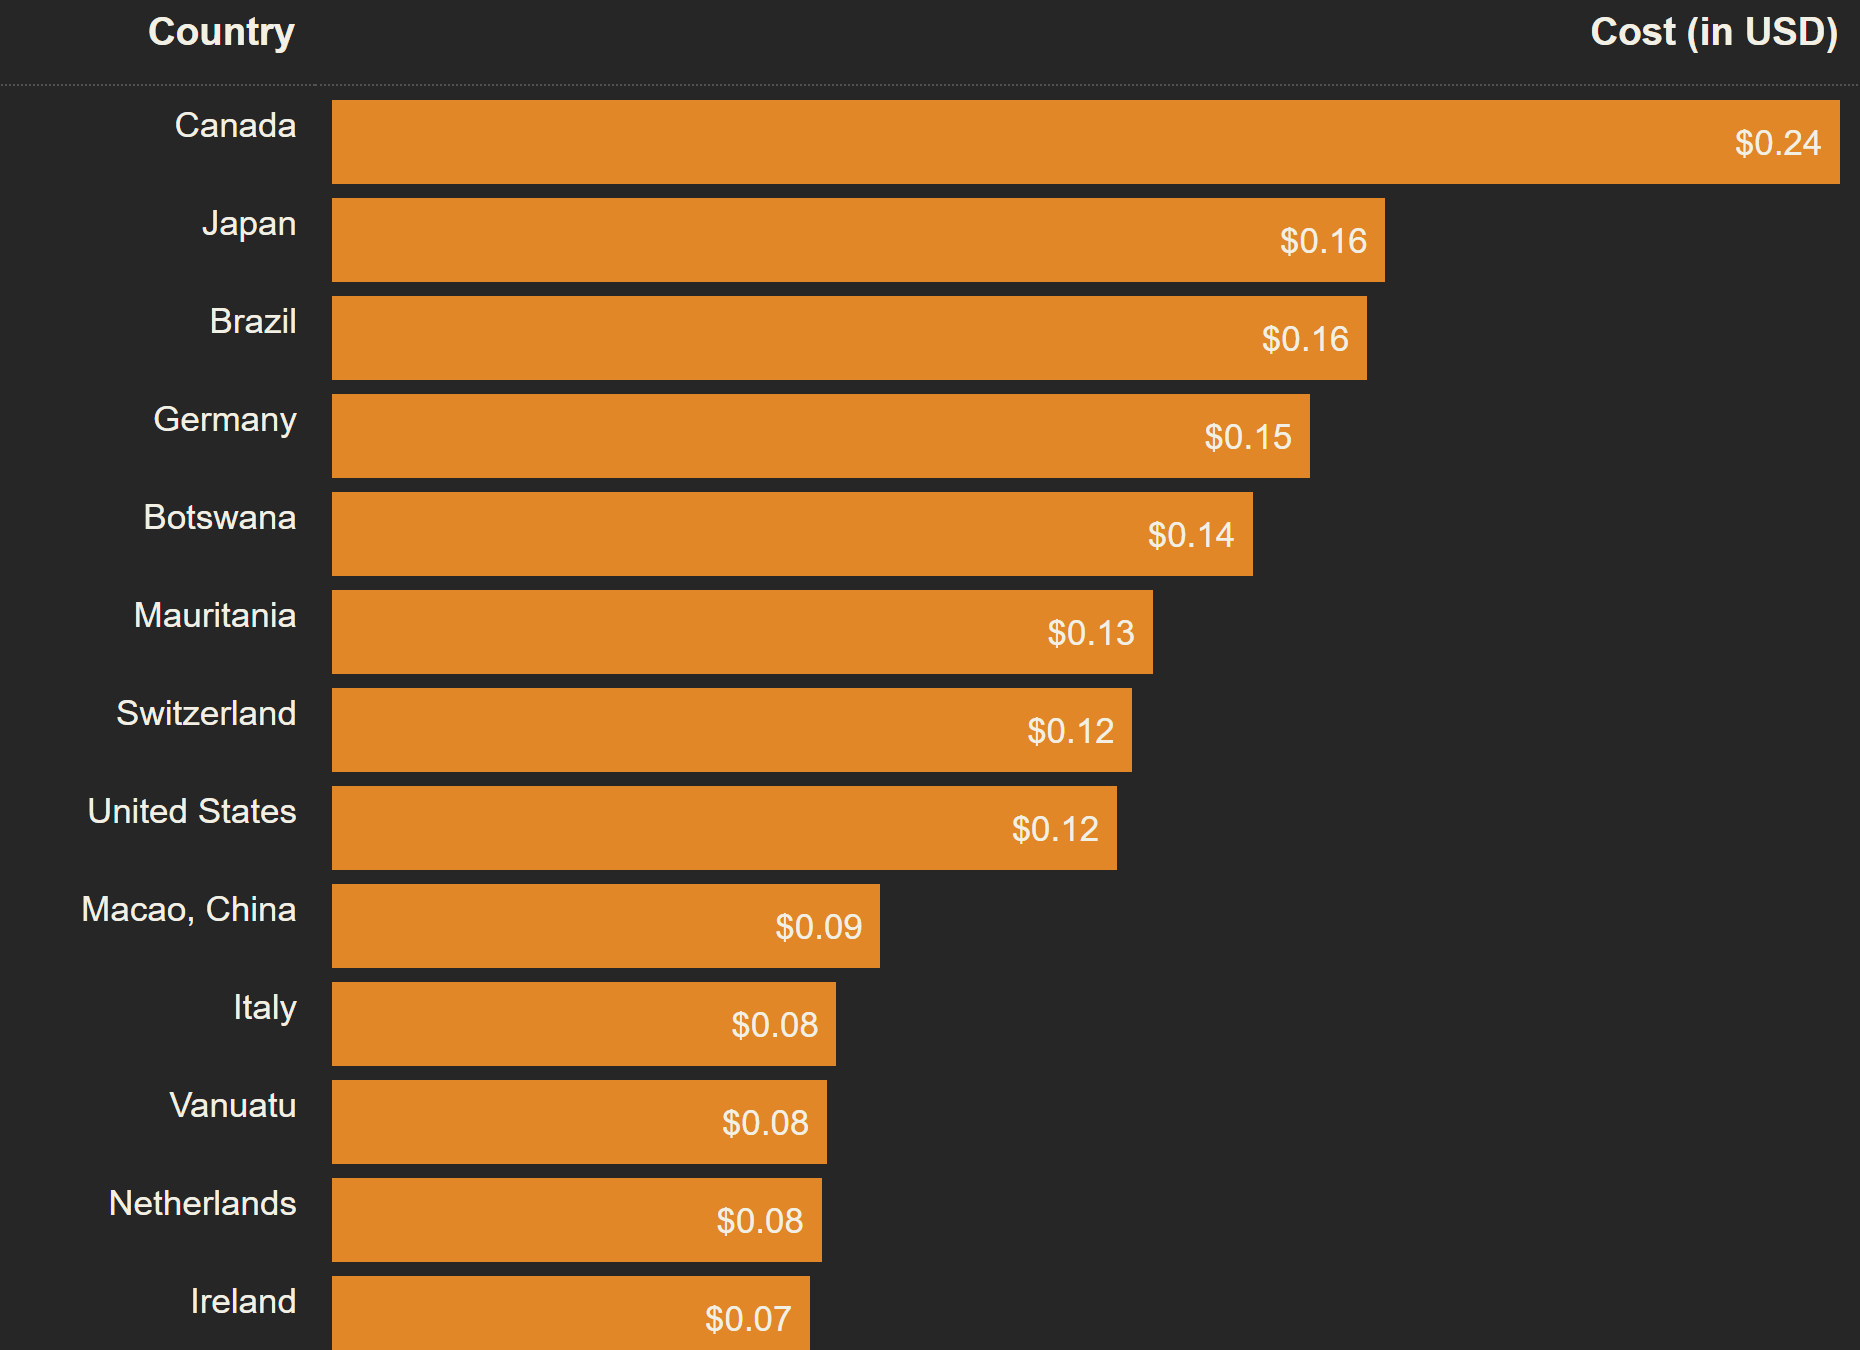
Our 5GB movie example from Cable.co.uk’s broadband league table would cost our friendly Canadian mobile user over $610 (sorry) but a mere $76 for our British chum (blimey!)
That better be one hell of a movie.
Optimizing for the benefit of the end user’s pocket is not usually the most important factor in optimization efforts, though it should be high up that list.
Data Factories pumping out pollution
So, every request costs people time, and every byte costs people money. Where can we go from here? What else is an important driving force for website optimization?
Well, your device needs electricity, and that electricity comes from somewhere. The data centre needs electricity too, as do all of the systems in the network between your device and the origin server.
1. The more requests made, the more electricity is needed to respond.
As Addy Osmani likes to inform us, Javascript bytes are much “heavier” than image bytes; your device has to do a lot more work to process javascript, draining power and even creating a little bit more heat pollution.
2. The higher the complexity of data that is sent, the more processing power on your device is needed to render the response on screen, and also at every touchpoint between server and client.
For example, let’s take a look at the neat little site webtest.app which runs two tests on the same url; one normally and one with the uBlock origin ad blocker extension enabled.
A test run for The Sun tabloid website shows the energy saved when blocking ads is 0.120 Wh, only taking into account data transfer; data processing throughout the page load, at every network hop, and on both the server and client, are not included.

0.120 What? Hours?
No doubt you’re thinking “Why should I care about 0.120 Watt hours?” Well, you’re asking some excellent questions! I like your style. We should be friends.
Let’s pop over to WebsiteCarbon.com and check that energy-sucking tabloid website again:
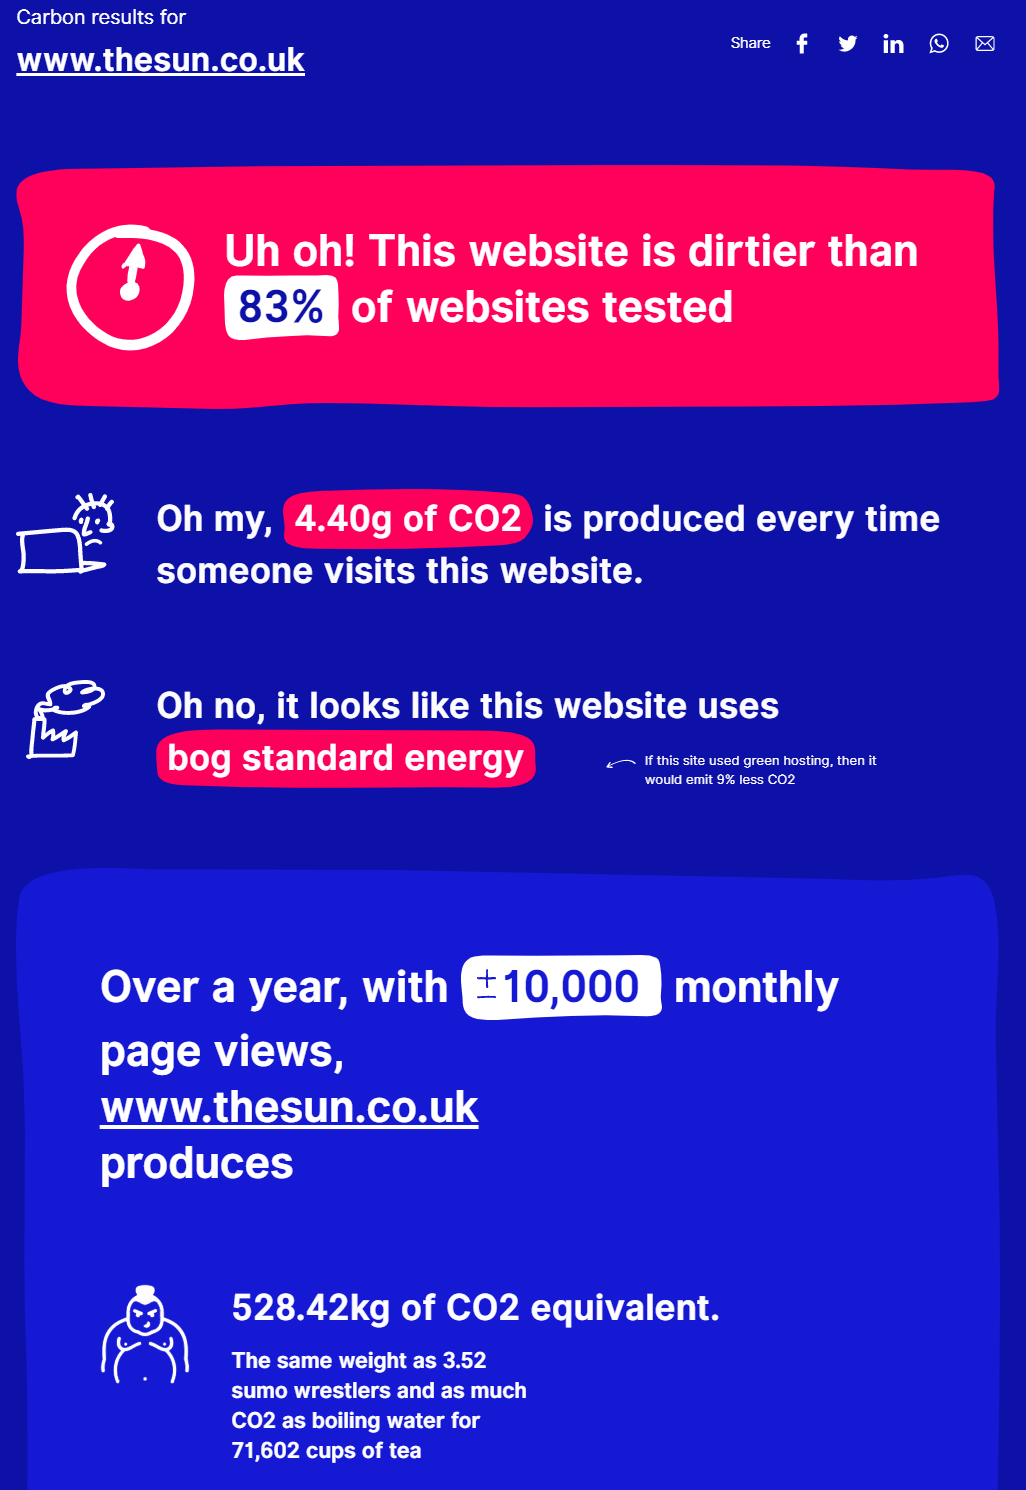
Now we can see the potential environmental impact of unoptimised websites; the carbon emissions over a month is calculated for 10k users (whereas The Sun tabloid’s website will get much more than that) and it’s equivalent to boiling water for over 70k cups of tea (yes, it’s an English website), and would need 25 trees planted to offset it.
3. The more requests made and the more data needed, the more energy used and the more co2 produced.
Take Action
So what can we do? You, my good performance specialist and lovely eco nerd, need to keep doing what you’re doing; fight the good fight and reduce your website’s footprint.
However, now you can also be armed with eco information in addition to the usual data about increasing profits, beating your competitors, and getting a 100 score in Lighthouse.
Saying to your client/boss “We need to optimise the javascript bundles to save the planet” sounds much better, doesn’t it? Captain Performance would be proud, and maybe grant you a power ring or something equally fabulous.
Unfortunately, sending data over internet uses energy, and is hard to measure; these tools are not accurate yet, so we’re having to approximate and extrapolate to a large degree.
Where can you go from here? Another excellent question! Read on…
Green Hosts
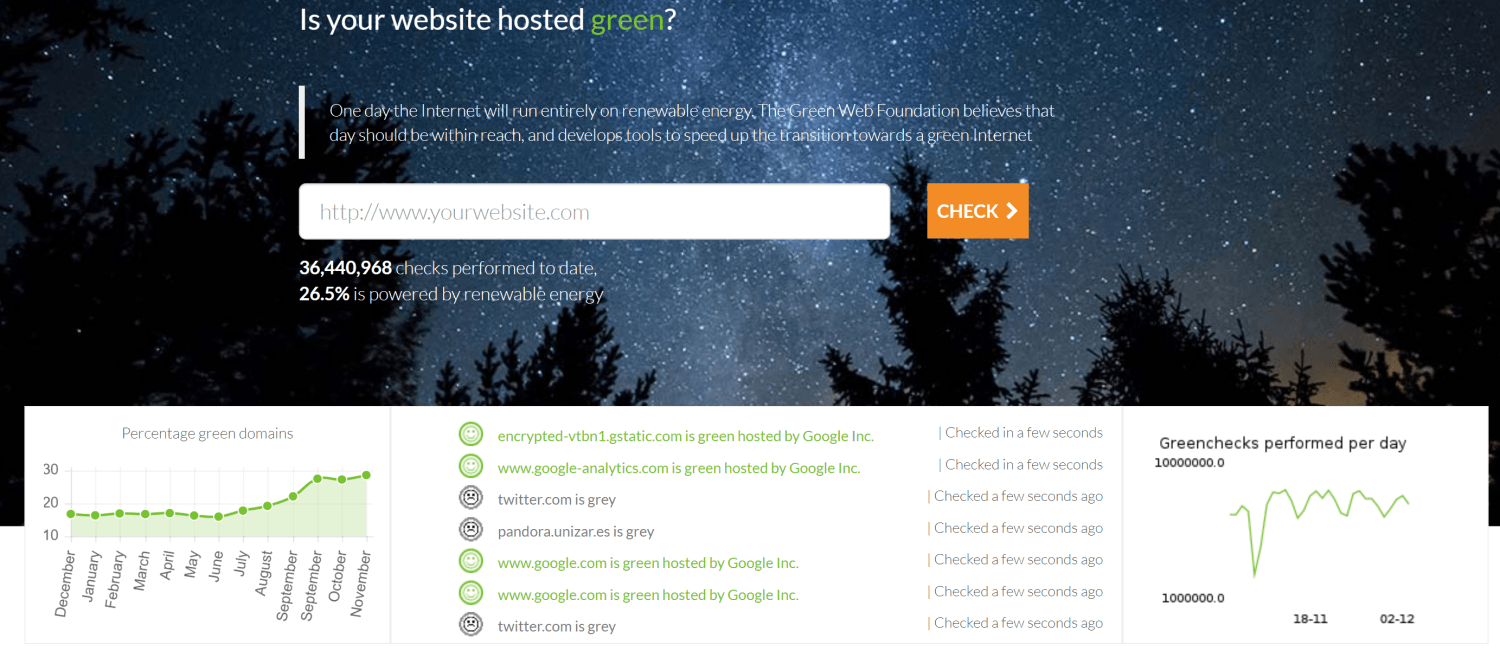
The Green Web Foundation (among other resources out there) will help you identify the hosts that do not use renewable energy sources to power their data centres, and even recommend those that do. You can install a Chrome extension that will highlight Google/Bing/Yahoo search results with a green underline if the result’s host uses renewable energy to help your personal Internet use be greener.
They have some great articles about their ideas and approaches to a greener internet, including carbon.txt; like robots.txt but for data centre energy sources, enabling traceability.
They even have a lighthouse plugin to add an extra audit to your lighthouse reports:
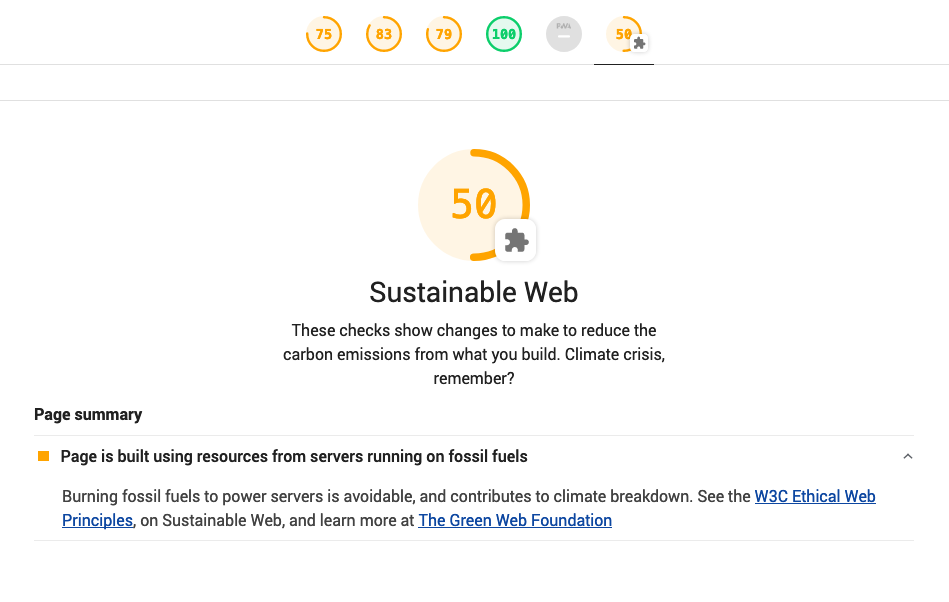
Read up on this plugin over on the GWF blog and help develop it by working on the open issues. I’ll be adding this plugin to my private WebPageTest installations from now on; maybe we can get it into the public version as well!
If you have your own private WebPageTest instance and would like to set up a custom agent using this extra feature, the only changes needed are installing the “lighthouse-plugin-greenhouse” plugin and configuring lighthouse to use this plugin on the agent, then adapt the install script to reference your version of the repo with these changes. Doing this will mean your WebPageTest lighthouse results that use a correctly configured agent will now include a Sustainable Web lighthouse score:
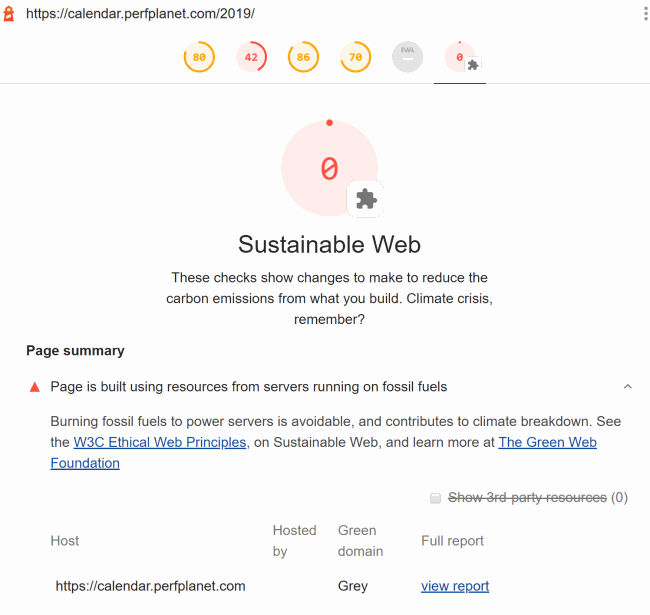
Cool, huh?
Tooling
Let’s recap:
- WebTest.app is a great way to show the impact of 3rd parties, including the eco impact.
- The Carbon Website Calculator is open source., so you can check out their calculations for yourself.
- The Green Web Foundation have an API.
If we smoosh Carbon Calculator’s logic and Green Web Foundation’s API together and throw a WebPageTest result at it, then we can check which requests come from domains that are on hosts that use renewable energy or not, and calculate how much co2 is being used per host, per request, based on this info.
The GWF API doesn’t like being hammered by too many requests in parallel currently, so this can be quite a slow process. A demo repo can be found here and a demo site to visualise this data is here; paste in a WebPageTest test ID and make a hot beverage of your choice, as it’ll take a while to finish.
You can try this out over at rposbo.github.io/greentree/ – add a WebPageTest test ID and hit “Go“!
The result will look something like this:
- the boxes represent requests, grouped by host.
- green boxes are hosts that use renewable energy, grey hosts do not.
- the size of the box represents bytes, energy used, or co2 emissions; bigger box, more of that thing; hover over to get a bit more info.
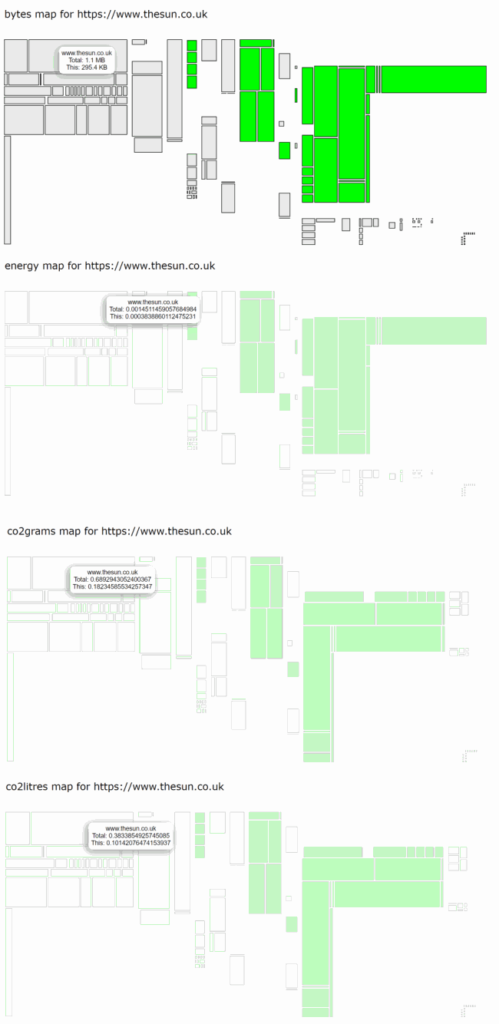
It’s a basic visualisation, though I’m sure you lovely Web Perf Eco nerds will love to improve it! PRs and issues needed. There’s a nodejs version in the repo in case you want to script it all up, backend style, or just the one index.html page used for the demo site.
Repo: https://github.com/rposbo/greentree
Hopefully this sort of consideration can be higher up the web performance priority list in the future; optimize for the good of the planet!
Interested? Fascinated? Excited?
- Check out the Green Web Foundation, the Carbon Calculator, and read up on how Service Workers can save the planet.
- Follow the #greenweb hashtag.
- Sign up to the Climate Action tech Slack.
- See if you can get some or all of your application on to green hosts (maybe convince your 3rd parties to do the same); chat with The Green Web Foundation for help with this.
- There’s plenty of info and plenty of need for help out there, so hit me up if you’re looking for a world-saving outlet for your epic optimization skills!
Do it for Captain Performance!