Stoyan (@stoyanstefanov) is a Facebook engineer, former Yahoo!, writer ("JavaScript Patterns", "React: Up and Running"), speaker (JSConf, Velocity, Fronteers), toolmaker (Smush.it, YSlow 2.0) and a guitar hero wannabe.
Let’s talk a bit about keeping tabs on how much CPU is consumed by an application’s JavaScript. And let’s frame the discussion around components – the atomic building blocks of the application. This way any performance improvement efforts (or regression investigations) can be focused on small (hopefully) self-contained pieces. I’ll assume that, as many other modern applications, your app is built by composing reusable bits of UI infra. If not, this discussion is still applicable, only you need to find a different way to divide and conquer your mountain of JavaScript code.
Motivation
Why do we need to bother with measuring CPU costs of JavaScript? Because these days, more often than not, the performance of our apps is CPU-bound. Let me loosely quote Steve Souders and Pat Meenan from the interviews I conducted for the Planet Performance Podcast. Both spoke about how we’re no longer network- and latency-bound. The networks are getting faster. We’ve also learned to gzip (or rather brotli) our text responses and we’ve learned to optimize our images. Easy stuff.
At the same times CPUs are becoming a bottleneck, especially on mobile. And at the same time our expectations about interactivity of modern web apps have grown. We expect UIs to be a lot more fluid. And this asks for more JavaScript. Also we need to keep in mind that 1MB of images is not the same as 1MB of JavaScript. Images arrive when they arrive, progressively. But JavaScript is often a requirement before the app becomes usable. There’s just too much JavaScript that needs to be parsed and executed on the fly and these are rather CPU-intensive tasks.
The metric
Using CPU instruction count as a metric allows us to divorce the measurement from the conditions of the machine. Any timing metrics (like TTI) are too noisy, they depend on network conditions, as well as on anything else that’s happening on the computer, like some intensive scripts you may be running at the same time as loading a page (or maybe some viruses are the ones running the background scripts for you). Maybe there’s a browser extension that’s killing your page. CPU instructions, on the other hand, are time-agnostic and can be really stable, as you’ll see in a minute.
The idea
So here’s the idea: setup a Lab that runs on every diff. By Lab I mean just a computer, maybe even the one you use daily. Source control systems give us hooks we can… well, hook into, and do these sort of checks. Of course, you can run the Lab after new code is committed but you know how much slower and less likely it becomes to fix code as it reaches the stages of commits, then beta, then production.
What we want is: for every diff we run our Lab on the before and the after code and compare the two. We want to compare components in isolation, so any uncovered problems are more focused.
Good news is we can do this using a real browser, for example using Puppeteer which is a way to drive headless Chrome from a Node.js script.
Finding the code to run
To find code to test we can reach into any sort of a style guide or design system or anything that gives us succinct, isolated examples of using a component.
What’s a style guide? Usually it’s a web app that shows off all the components or “building blocks” of UI elements available to the developers. This could be a third-party library of components or something built in-house.
Looking for examples in the wild, I bumped into a recent tweet thread asking for newish React component libraries, and then I checked out a couple of the suggestions given by fellow twitters.

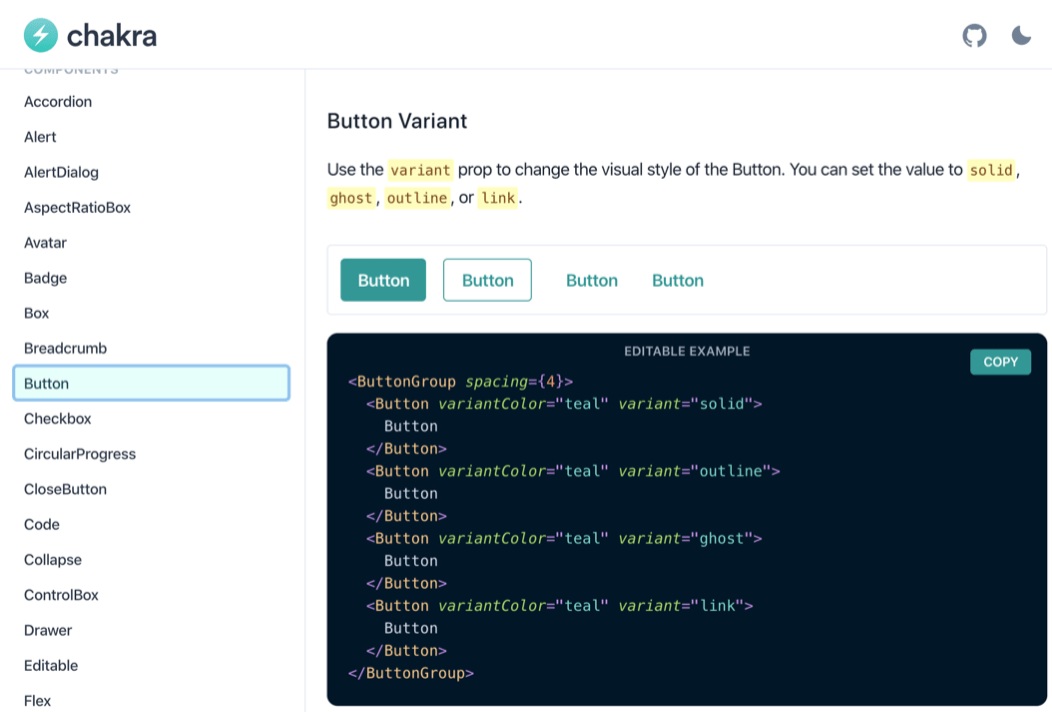
Not surprisingly, high-quality modern offerings come with documentation pages that include examples of working code. You can see here two libraries and their respective Button components, documented with examples of how to use them.

Chakra’s docs about their Button component

Semantic UI’s docs about their Button component
This is what we need, these are the examples we can use to measure CPU costs. The examples may be buried in documentation or in Javadoc-style comments in the code or maybe, if you’re lucky, they are separate files just like unit test files (yup, because we all write unit tests, right? Right?).
Files
For illustration let’s imagine that your library has a Button component that lives in Button.js and together with it there’s a unit test Button-test.js and an example file Button-example.js. Now we want to create a test page of some sort where our example code snippets can be run, something like test.html#Button.
Component
Here’s a simple Button component. I’m using React for illustration but your components may be written in any way you like.
import React from 'react';

const Button = (props) =>
  props.href
    ? <a {...props} className="Button"/>
    : <button {...props} className="Button"/>

export default Button;
Example
And here’s what an example of the Button‘s usage may look like. As you can see in this case we have two examples that exercise various properties.
import React from 'react';
import Button from 'Button';
export default [
  <Button onClick={() => alert('ouch')}>
    Click me
  </Button>,
  <Button href="https://reactjs.com">
    Follow me
  </Button>,
]
Test
Here’s the test.html page that can load any component. Notice the performance.* calls. This is how we leave custom marks in the Chrome trace file which is going to become useful in just a second.
const examples =
  await import(location.hash + '-example.js');

examples.forEach(example =>
  performance.mark('my mark start');
  ReactDOM.render(<div>{example}</div>, where);
  performance.mark('my mark end');
  performance.measure(
    'my mark', 'my mark start', 'my mark end');
);
Runner
To load our test page in Chrome we can use Puppeteer, a Node.js library that provides an API into telling the browser what to do. You can run Puppeteer in any OS. It brings its own Chrome, but you can use your existing Chrome, Chromium or Canary version. You can run Chrome heedlessly (meaning no browser windows are visible) because you don’t need to look at the test page, it runs automatically. You can also run Chrome as usual, which is good for debugging.
Here is a sample command-line Node.js script that loads the test page and enables writing of the trace file. Anything that happens in the browser between tracing.start() and end() is written, in excruciating detail I may add, to trace.json.
import pup from 'puppeteer';

const browser = await pup.launch();
const page = await browser.newPage();
await page.tracing.start({path: 'trace.json'});
await page.goto('test.html#Button');
await page.tracing.stop();
await browser.close();
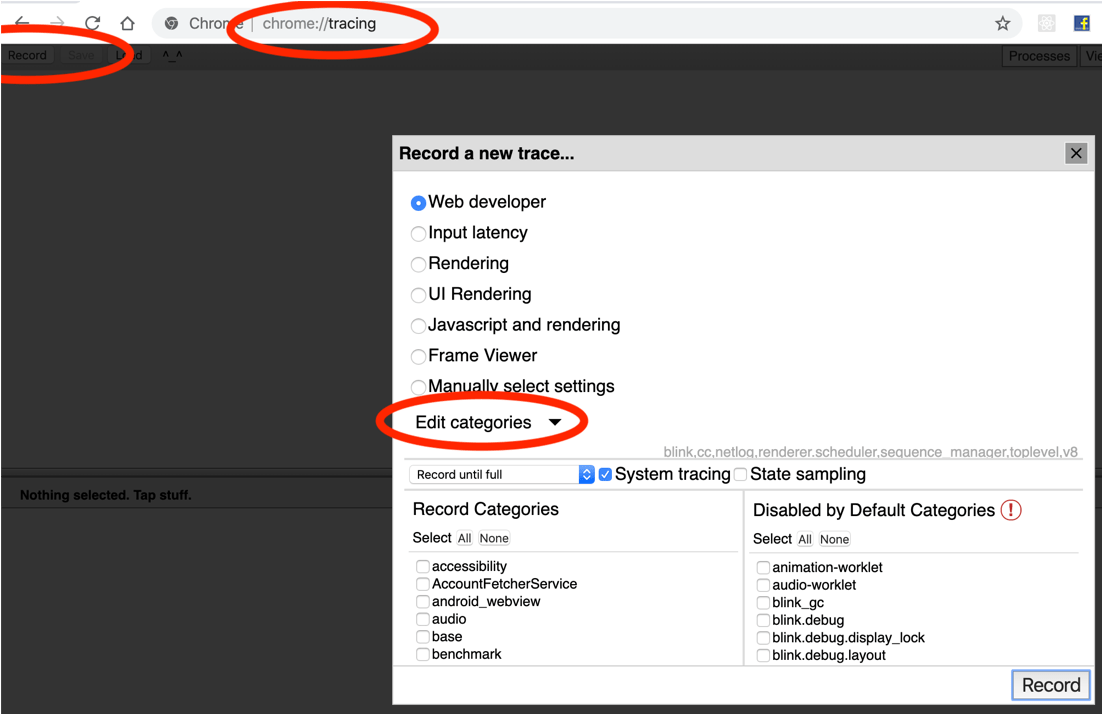
You can actually control the level of excruciating-ness by specifying trace “categories”. You can see the available categories in the browser you’re using by opening a tab, pointing it to chrome://tracing, then hitting “Record” then clicking “Edit categories”.

Results
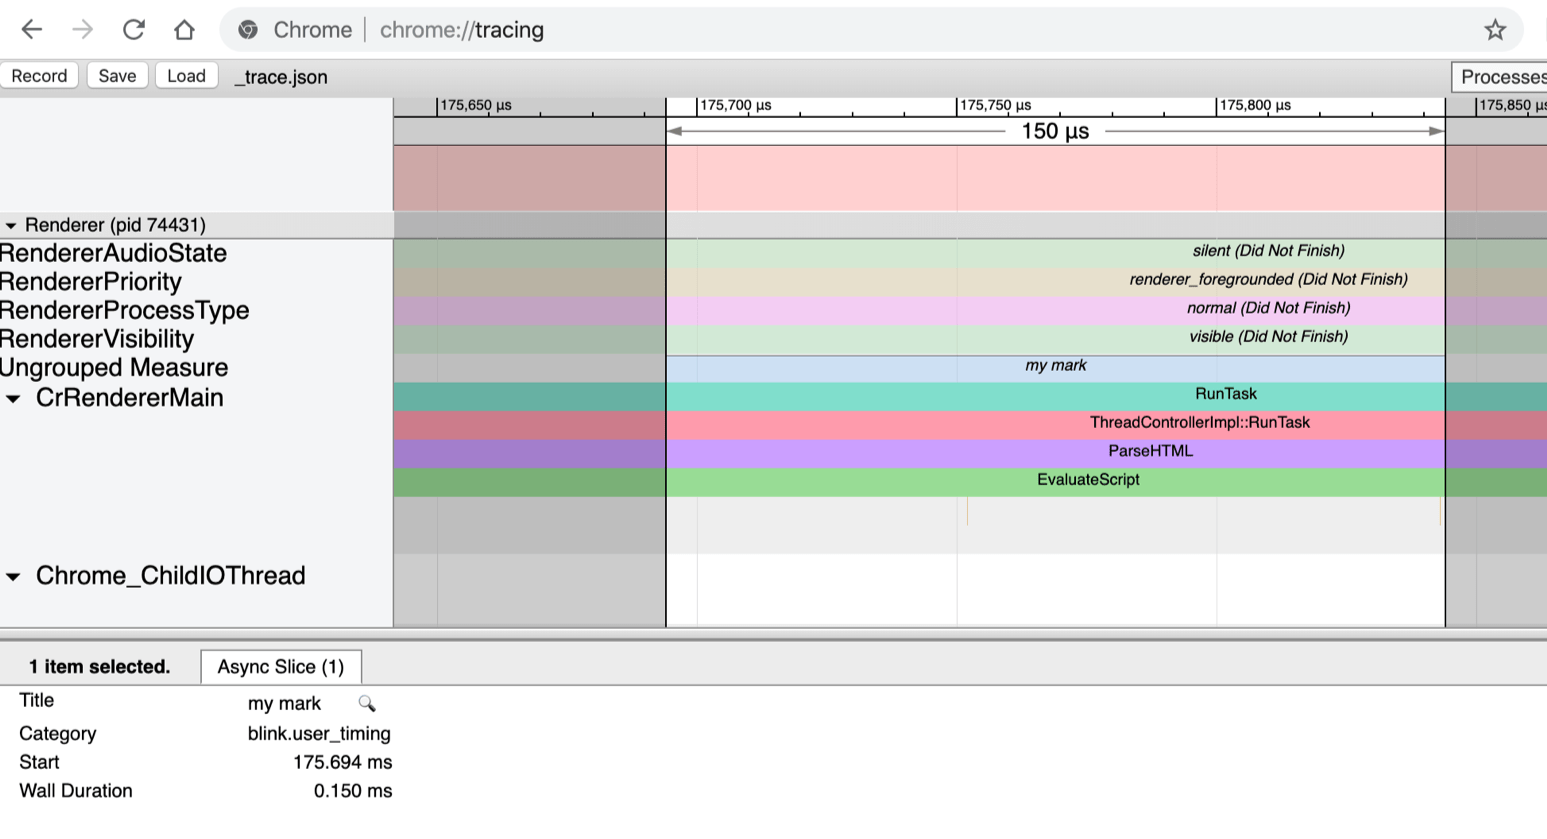
So, after you used Puppeteer to load your test page, you can see what just happened by going to chrome://tracing and loading the trace.json file you just recorded.

Here you see the result of calling performance.measure('my mark'). The measure() call is purely for debugging, in case you want to open the trace file and look around. Everything that happened is in this “my mark” block.
And this is an excerpt from the trace file.

All you need to do is subtract the number of CPU instructions (ticount) of the Start marker from the End marker. That gives you the number of CPU instructions required to render your component in the browser. A single number you can use as a signal whether this diff is a regression.
The Devil’s in the details
All we measured was initial rendering of the single example component. Nothing else. It’s imperative to measure the least amount of work you can, in order to reduce noise. The devil is in the details. Measure the smallest thing. Then exclude things that are out of your control, like Garbage collection for example. Your component doesn’t control garbage collection, so if it so happens that the browser decides to collect garbage while rendering the component, the CPU cycles taken by GC should be subtracted.
The name of the Garbage collection block (event is the proper term) is V8.GCScavenger and its tidelta should be subtracted from the instruction count. There’s a document describing the trace events, however it’s outdated and does not (update: it does!) include the two events we need:
tidelta– number of instructions of this event andticount– number of instructions at the start of this event
You have to be really careful about what you’re measuring. Browsers are smart. They start optimizing code they run more then once. In this graph you see how the number of CPU instructions required to render a random component sharply decreased as you render it more than once. So think about that.

Another detail: if the component does any sort of async work like a setTimeout() or a fetch(), this work is not counted. This could be good. Or not. Think about instrumenting any async work separately.
Strong signal
And if you carefully think about what you measure, you can get a really stable signal about any change. I kind of like the flatness of these lines here.

The bottom one is running the Lab 10 times and rendering a simple <span> in React, nothing else. That’s between 2.15M to 2.2M CPU instructions. Then wrapping the <span> in a <p> takes us to about 2.3M instructions. This level of precision amazes me. Being able to tell the cost of just one more paragraph is powerful.
How are you going to present these precise results is a nice problem to have, because you can always be less precise.
Supporting info
Now that you have The One True Number To Rule Them All you can do other things using the same infra. With performance.mark() you can write more supporting information to trace.json and hint the developers what could be going on so that the number of CPU instructions is up. You can report on the number of DOM nodes, or the number of React commits (when React writes to the DOM) and so on. You can count the number of layouts (reflows). You can also take screenshots with Puppeteer and show the before/after UI. Sometimes it’s no wonder that the CPU instructions went up if you just added 10 buttons and 12 rich text editors to the UI.
Available today?
Can you use this functionality and build your Lab today? Yup! You need a Chrome version 78 or above. You can tell by looking in the trace file for ticount or tidelta. Earlier versions don’t have these in the traces.
The instruction counts are not available on a Mac, unfortunately. And I have not tried Windows yet, so cannot say. Unix/Linux is your friend.
To make the instruction count work you also need these two flags --no-sandbox and --enable-thread-instruction-count.
await puppeteer.launch({
  args: [
    '--no-sandbox',
    '--enable-thread-instruction-count',
  ]});
Thank you for reading and let’s count some instructions to keep a continuous eye the CPU utilization of our apps!
