

Read any performance blog or attend any performance talk and everyone will advise you that optimising images is the best place to start (insert the ever present low hanging fruit phrase here). With the use of automated services you can achieve smaller images in a relatively short period of time. And we all know smaller images will give us better performance, or does it?
Having spent the last couple of years dealing with escalations when customers flick the image optimisation switch but then see no change in performance, it is worth sharing a few examples of how best to deal with the situation if it happens to you.
Optimising your images is like buying a fast car: unless you have nice clear roads to drive on you won’t get anywhere faster. Often the rest of the website is like a gridlocked motorway and the benefit from the extra horsepower goes to waste. Below are some tips on how to clear the traffic.
Case 1
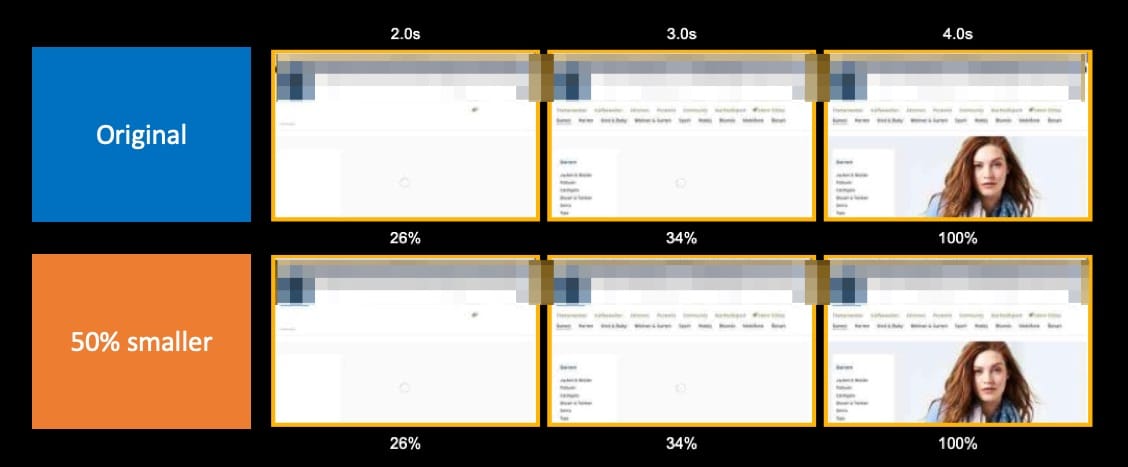
Company logos and menus have been blurred to protect identity.
On the website above, images bytes were reduced from 1MB to 500KB (50%) but there were no changes in performance.
When digging deeper on this site the main issue was that nearly all images on the site were lazy-loaded using JavaScript.
Removing the lazy-loading for the main product image was a major improvement. While I can’t remember exactly what was done with the remaining images, I would always suggest checking if they are on the screen during the initial load and if not, think about lazy-loading, whether using JS or with native lazy loading.
We also deferred a script or two and preloaded some fonts for this site, the improved results are shown below.

Case 2

The results of the image optimisation project above were not that bad:
- Images reduced from 2.4MB to 1MB (55% smaller)
- Visually ready improved by 2 seconds
However, initial feedback from the customer was that performance and user experience had not improved enough. From the film strip above you can see the main rendering pattern was similar between the before & after. The blank dark area displayed in both at 2 seconds (shown below) before being shifted down when the 2 main images started loading at 3 seconds.

Looking in more detail at this site we found that the pop up menu contained hidden images on every menu tab and these were all loaded at the top of the page with the highest priority.
Lazy-loading these hidden images as well as some reorganisation of CSS and JavaScript in the head of the page allowed the main images to be loaded higher up the page and improve the user experience. The main images now start loading a full second faster and the dark grey space no longer appears in the viewport.

Despite all of the optimisations above and some font preloading the start render time seemed to be fixed at about 1.5 seconds. This customer was using Optimizely which was delaying render. Removing Optimizely reduced start render down to less than 1 second. I am not going down the route of whether it is right or wrong to use client side A/B testing tools, that is a whole other blog post. What I will say is if you are carefully measuring the impact of optimising something as big as images, make sure you are aware of any technology that is reducing the benefit, then decide if you want to keep it on or turn it off while you test.
Case 3

At first glance this site looks amazing as the following stats confirm;
- ~5MB of images down to ~400KB (92% reduction)
- Visually ready down from 7s to 4s
- Start render improved by 2 seconds
Despite these improvements the first paint of the hero image was relatively unchanged. Digging deeper we found the hero image was loaded as a background image which delayed its loading. Changing this to an <img/> element improved rendering time to be inline with the byte savings as shown below.
We also found a couple of scripts that were loaded at the bottom of the markup positioned historically to load last. The browser pre-parser was pulling these up and loading before the images so we added defer to the scripts.

Further Analysis
After working on the cases above and other similar ones, I wondered if there were any high-level patterns we could use to predict this issue arising before optimising the images.
I went back and looked at over 20 customer sites that had recently optimised images, ran them through webpagetest.org and ranked them by SpeedIndex percentage improvement. They were marked against 16 sets of criteria grouped by Page stats, Image Stats, JavaScript Stats and Loading techniques. Criteria included things like:
- Percentage of image bytes on the page
- Percentage of images vs. JavaScript
- Actual image bytes
- Whether images were hosted on the same domain
- If A/B testing was being used
After scoring the sites against the 16 criteria it turned out it is more likely to see significant improvement in SpeedIndex if your site adheres to the following budgets:
- 43% or more of total page objects are images
- Less than 30 TCP connections (e.g. not too many 3rd parties)
- Less than 400KB of JavaScript (on the wire)
- JavaScript less than 45% of image bytes
- After optimising images, save at least 50% of bytes OR at least 1MB *
* This criteria will need to be measured after optimising images, however WebPageTest does give some potential savings when analysing all images.
If your site fails two or more of these criteria I would suggest you have other bottlenecks on your page that need fixing before tackling images.
Summary
I love optimising images, I think it is one of the easiest performance optimisations to do. However, before optimising your images you should have realistic expectations about what you’re aiming to achieve. Good performance is about more than reducing bytes. There are many moving parts involved in loading a web page and often removing one bottleneck just reveals another.
When conducting an image optimisation project I recommend the following:
- Be clear on how you measure the impact
- Pick a visual metric (Speedindex, Largest contentful paint, etc.)
- Use the correct tool, WPT is good for spot-checks and debugging, RUM will be needed to see the impact in the real world
- Check against the criteria above, if your site does not meet those, set the expectations correctly with others
- Make sure images in the viewport are loaded as quickly as possible
- Manage lazy-loading properly
- Use
<img/>tags (including responsive images) not CSS background images - Defer any scripts to load after critical images
- Think about the role of A/B testing tools during your evaluation